Brand health tracking
Brand health tracking is a survey of category buyers, repeated on a fixed schedule, that measures how a brand sits in their memory against competitors, so a team can see whether its marketing is building the brand and catch problems before sales move.
Brand health tracking is a survey of category buyers, repeated on a fixed schedule, that measures how a brand sits in their memory against competitors: awareness, consideration, preference, brand perceptions and, in newer designs, mental availability across buying situations. Teams use it to check whether marketing is building the brand and to spot early warning signs before sales move.
- Origin
- Funnel logic from Robert Lavidge and Gary Steiner; commercial trackers from Millward Brown, Kantar, Ipsos and others; buyer-based redesign by Jenni Romaniuk, Ehrenberg-Bass Institute, 1961 (hierarchy of effects); 2023 (Better Brand Health)
- Level
- 401 · Expert
- Fits
- Scale-up, Enterprise
- Time to apply
- four to six weeks to design and field a first wave, then one survey wave per quarter or per half-year
- What you need
- a clear definition of the category and of who counts as a category buyer · a survey panel or research agency that can reach category buyers, including people who have never bought from you · your sales or customer data for the same periods, so tracker results can be checked against what people actually did
Brand health tracking is a survey of category buyers, repeated on a fixed schedule, that measures how your brand sits in their memory compared with competitors. A typical tracker asks who knows the brand, who would consider it, who prefers it, what people think it stands for and, in newer designs, which buying situations bring it to mind. Marketing teams use the results to judge whether spending is building the brand and to catch a slide before it reaches sales.
Jenni Romaniuk of the Ehrenberg-Bass Institute, whose 2023 book Better Brand Health is the most detailed recent treatment, describes brand health as the effect marketing has had on buyers’ memories of brands in a category, in an interview republished by the Institute. The definition is useful because it rules things out: website traffic and follower counts can matter, but they do not measure what buyers remember.
What does a brand health tracker measure?
Most trackers combine five families of questions. The table shows what each tells you and where it misleads.
| Metric family | Typical question | What it tells you | Watch out for |
|---|---|---|---|
| Awareness | “Which brands of X can you think of?” then a prompted list | Whether buyers know the brand exists | Tests one cue, the category name |
| Consideration | “Which would you consider next time?” | Whether the brand is in the running | Rises and falls with user numbers |
| Preference and usage | “Which do you prefer?”, “Which did you buy last?” | How many buyers choose it | Recent purchase is more reliable than stated intent |
| Perceptions | “Which brands are good value?” | What the brand is linked to | Big brands score higher on almost everything |
| Mental availability | “Which brands come to mind when [buying situation]?” | How many situations and buyers retrieve the brand | Needs a list of buying situations collected from buyers |
The last row is the main addition of the past two decades. Its metrics, mental penetration, mental market share and network size, are explained on the mental and physical availability page, and the buying situations they rely on are covered under category entry points. Rachel Kennedy of the Institute explains why its researchers talk about building mental availability rather than mass awareness.
Where the funnel came from
The funnel in most trackers goes back to advertising theory. In 1961 Robert Lavidge and Gary Steiner proposed in the Journal of Marketing that advertising moves people through steps toward purchase: awareness, knowledge, liking, preference, conviction and purchase, as a 2022 review of such models lists them.
Research firms turned the steps into a measurement system. Millward Brown’s BrandDynamics pyramid, described in WARC’s SWOCC collection, runs from presence through relevance, performance and advantage to bonding, and treats the share of people who move from one level to the next as a measure of brand strength.
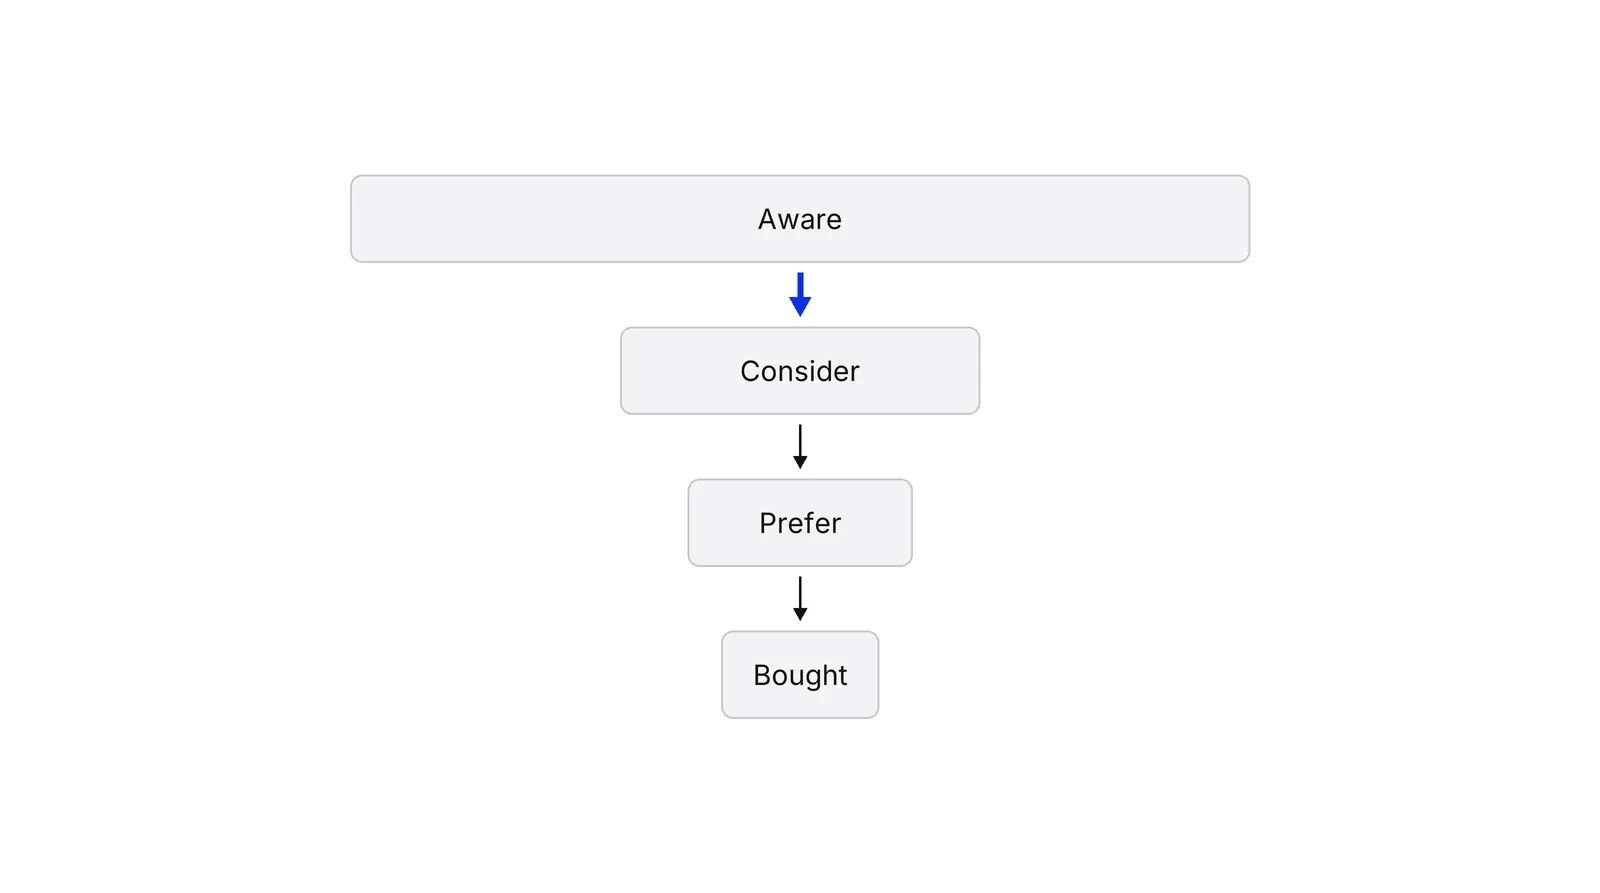
The useful habit from this tradition is to read conversion rates, not stage sizes. Take an illustrative brand that 80% of category buyers know but only 32% would consider: a 40% conversion, which more awareness spending will not fix. The funnel has critics. Research Live reported in 2009 that McKinsey’s David Court and colleagues, drawing on a survey of about 20,000 consumers, found buyers do not narrow a list neatly: the number of brands considered can grow during evaluation.
How the big vendors package it
Commercial trackers share the funnel core and differ in the model on top. The vendors’ performance claims are their own; we found no independent audit we could open.
| Vendor | Product | What it adds |
|---|---|---|
| Kantar | BrandDynamics, Brand Guidance | Scores brands as meaningful, different and salient. Kantar claims its strongest brands win 9 times the volume share and says the framework was verified by the Marketing Accountability Standards Board. BrandDynamics, launched in 2023, adds daily benchmarks and short-term forecasts |
| Ipsos | Brand Value Creator | Separates “desire for the brand” from the market effects that influence choice, then runs driver analysis, per Ipsos. The tool came from Synovate, which Ipsos bought in 2011 |
| YouGov | BrandIndex | Tracks 16 metrics daily, including awareness, consideration, buzz and recommendation |
Kantar’s own analysts add a caution. Nigel Hollis wrote in 2020 that about a quarter of growing brands grew on salience alone, and that rising salience may follow growth in buying rather than cause it.
Romaniuk’s critique: design for the category, analyse for the buyer
Romaniuk’s book argues that many trackers measure the wrong people and keep the wrong questions. John Fanning’s review in Marketing.ie summarises her preface: trackers focus on heavy, loyal buyers when growth comes from light buyers and non-buyers; questions get added on fashion; and nobody dares to remove old ones. Her rule is “design for the category, analyse for the buyer, report for the brand.”
The analysis rule rests on an old finding. Bird, Channon and Ehrenberg showed in 1970 that people who use a brand are far more likely to say it has any favourable attribute. Former users come next, and never-users are lowest. Riquier and Sharp’s 1997 summary puts former users at roughly twice the rate of people who never tried the brand. Romaniuk, Bogomolova and Dall’Olmo Riley retested it on 45 new data sets and found the link still holds. The same bias shows up in advertising recall: users remember a brand’s ads better than non-users across six measures, according to a 2016 study.
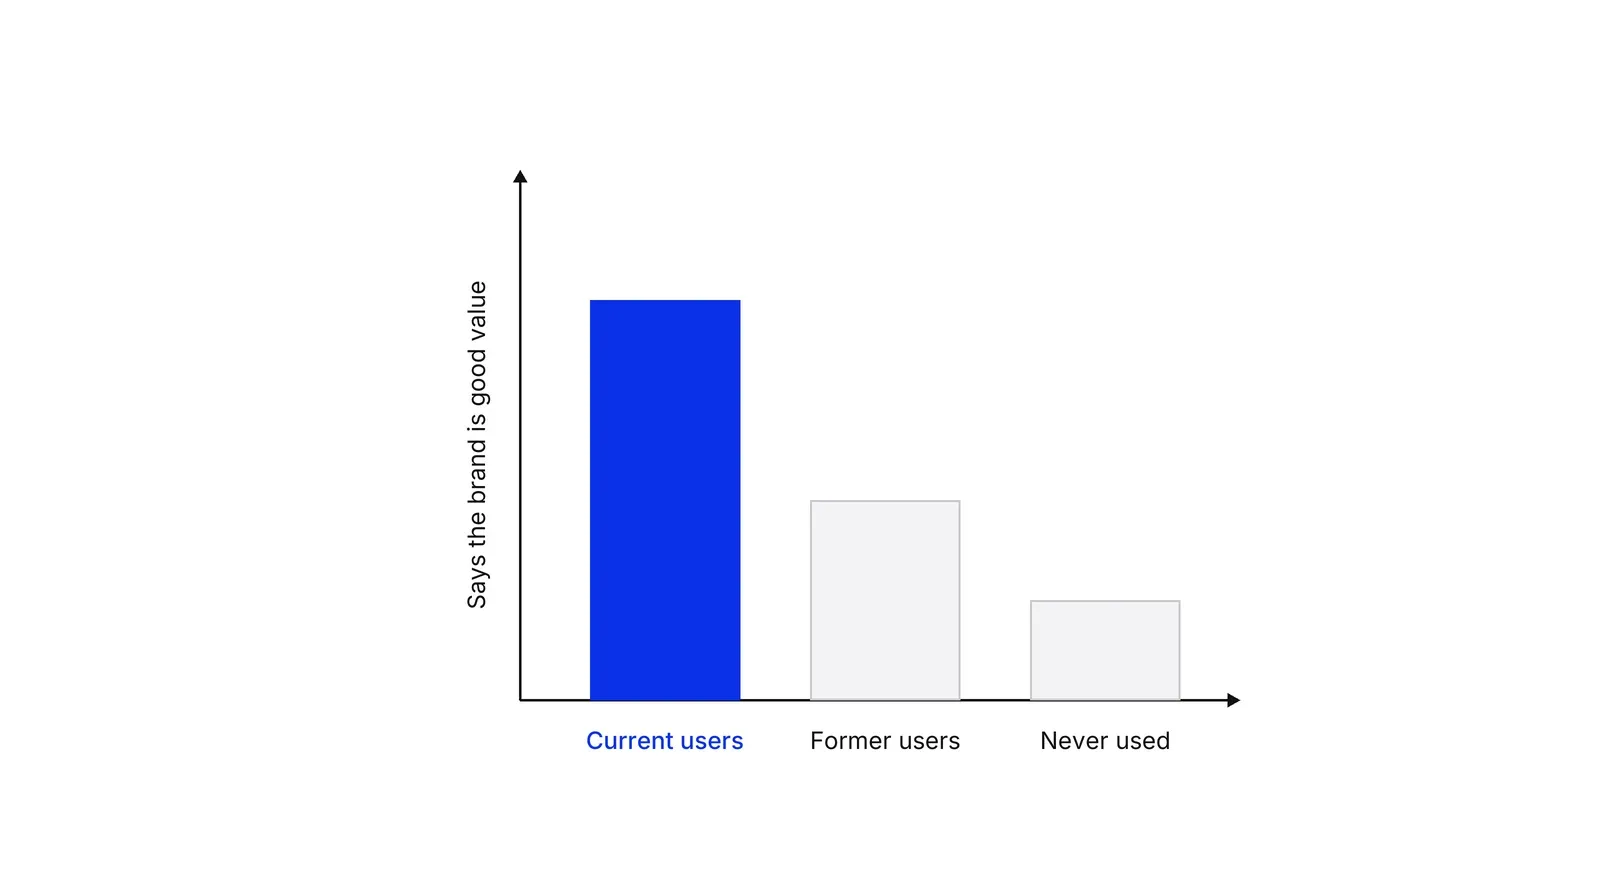
The practical result: when a perception score rises, check whether the share of users in the sample rose first. In her interview Romaniuk says most demographic differences in trackers are “driven by the number of buyers or non-buyers” in each segment.
Do tracker metrics predict sales?
Yes, partly, and the evidence is strongest for low-involvement categories. Srinivasan, Vanhuele and Pauwels found that advertising awareness, consideration and liking explained almost a third of the explained variation in sales across four French grocery categories (Journal of Marketing Research, 2010). A follow-up by Hanssens and colleagues in Marketing Science showed that adding attitude metrics improves sales forecasts. Pauwels and van Ewijk found in 2020 that survey metrics add a lot in low-involvement categories and little where buyers already research online.
Not every metric pulls the same way. In ten years of US car data, Stahl and colleagues found brand knowledge helped acquisition, retention and margin, while differentiation raised margin but lowered acquisition and retention (Journal of Marketing, 2012). Single headline scores deserve caution too: Keiningham and colleagues could not replicate the claimed superiority of the Net Promoter Score as a growth predictor (Journal of Marketing, 2007).
Sample size and frequency
Frequency is a sample size question. At 95% confidence, a 30% score carries a margin of about plus or minus 6.4 points with 200 interviews, 4.5 with 400 and 2.8 with 1,000. A change between two waves has a wider margin: about 6.4 points at 400 per wave and 4.0 at 1,000. Monthly waves of 200 will mostly show noise, so many brands are better served by quarterly or half-yearly waves with larger samples. In our marketing operations work, a tracker earns its budget once its results sit in the same review as sales and penetration.
How to apply Brand health tracking, step by step
- Define the category and the sample. Write down which purchases count as the category and who counts as a buyer, for example adults who paid for a dental service in the last 12 months. Sample category buyers, not your customers. Result: a sampling frame that includes buyers of rivals and people who have never bought from you.
- Pick a short list of metrics. Choose one or two measures per job: awareness (unaided and prompted), consideration, recent purchase, perceptions on a few attributes, and links to buying situations if you track mental availability. Drop anything nobody will act on. Result: a questionnaire that takes under 15 minutes and that you can keep stable for years.
- Ask the same questions about every brand. Show all major brands in the category, in rotated order, with identical wording. Romaniuk's test is whether any competitor would be happy to use the same tracker. Result: scores you can compare across brands, because no question was written around your own brand.
- Size the sample for the change you need to see. Work out the margin of error before you set the frequency. At 400 respondents per wave, a 30% score carries about plus or minus 4.5 points, and a change between two waves needs about 6.4 points to stand out. Result: a frequency and sample size where a real shift can be told apart from noise.
- Analyse by user group before you read movements. Split every result into current users, former users and people who have never used the brand. A score that rose only because the share of users in the sample rose is not a perception change. Result: a reading of brand health that is not distorted by the size of the brand.
- Report against sales and competitors. Put tracker results next to sales, penetration and the same scores for rivals, and look at trends over several waves rather than single movements. Result: a short report that says which metrics moved, whether the move is real and what the team will do about it.
Examples
Mind-set metrics and sales in French grocery categories
Shuba Srinivasan, Marc Vanhuele and Koen Pauwels modelled four-weekly tracker and sales data for brands of breakfast cereal, bottled water, fruit juice and shampoo in France from 1999 to 2006 (Journal of Marketing Research, 2010). Advertising awareness, consideration and liking explained almost one-third of the explained variation in sales, and competitors' scores mattered about as much as the brand's own. The metrics moved before sales did, which gave managers time to react.
A payments app reading its funnel
Illustrative, no real company implied. A payments app surveys a large panel of small business owners each quarter. 80% know the brand, 32% would consider it, 20% prefer it and 14% have paid with it in the last three months. Conversion from awareness to consideration is 40%, while each later step converts at 63% and 70%. The team stops buying more awareness and tests whether business owners link the app to buying situations such as paying a supplier abroad.
A clinic group checking a perception gain
Illustrative. A clinic group sees the share of respondents who rate it modern jump from 30% to 36% in one wave of 400. Split by user group, current patients rate it at the same level as before; the sample simply held more current patients this time. The difference is also inside the 6.4 point noise band for two waves of 400. The team reports no change and waits for the next wave.
When to use it
Use it when a brand spends enough on marketing that leadership asks what the money is building, when you need early warning of a slide before it shows in sales, or when you want to compare your brand with competitors on the same yardstick. It suits categories with many buyers and a market large enough to sample: consumer goods, retail, banking, payments, insurance, telecoms, clinic chains.
When not to use it
Skip a full tracker when the brand is so small or new that almost nobody in a sample of category buyers has heard of it; a few hundred interviews will show near-zero scores that barely move. Enterprise sellers with a few dozen named accounts learn more from win-loss interviews and account research. A tracker also cannot test an individual advertisement; use ad pretesting or controlled experiments for that.
Common mistakes
- Surveying only customers or a CRM list, which hides how few non-buyers think of the brand and inflates every score.
- Reading wave-to-wave movements smaller than the margin of error as wins or losses, and changing plans because of noise.
- Comparing perception scores across brands without allowing for user numbers, so the biggest brand looks best on almost every attribute.
- Adding questions every year for internal stakeholders and never removing any, until the survey is long and respondents rush it.
- Treating one headline index or a Net Promoter Score as proof of growth without checking it against your own sales data.
FAQ
What is brand health tracking?
Brand health tracking is a survey of category buyers repeated at fixed intervals to measure how a brand sits in their memory compared with rivals. Typical measures are awareness, consideration, preference, perceptions and, in newer trackers, links to buying situations. Jenni Romaniuk of the Ehrenberg-Bass Institute describes brand health as the effect marketing has had on buyers' memories.
What metrics should a brand health tracker include?
Keep a short core: unaided and prompted awareness, consideration, recent purchase or usage, a few brand attributes, and mental availability measured across buying situations. Ask every question about every major brand in the category. Add advertising awareness if you run campaigns. Drop metrics nobody acts on, since long questionnaires lower answer quality.
How often should you run a brand health tracker?
Most brands need a wave every quarter or every six months; monthly tracking pays off only with large samples. Memory-based metrics move slowly, and with 400 interviews per wave a 30% score has to change by about six points before the change stands out from sampling noise. Vendors such as Kantar and YouGov also sell daily tracking.
What is the difference between brand health and brand equity?
Brand equity is the extra value a brand name adds, which Kevin Lane Keller defined in the Journal of Marketing as the different response buyers give to marketing when they know the brand. Brand health is the set of tracked measures used to watch that equity over time. Equity is the concept; a tracker is the measuring instrument.
How many respondents does a brand tracker need?
Work back from the smallest change you need to detect. A 30% score has a margin of about plus or minus 6.4 points with 200 interviews, 4.5 with 400 and 2.8 with 1,000, at 95% confidence. Comparing two waves roughly widens the margin by 40%, so 1,000 per wave detects changes of about four points.
Sources
- Ehrenberg-Bass Institute, Books: Jenni Romaniuk, Better Brand Health, Oxford University Press, 2023
- Ehrenberg-Bass Institute (republished from Contagious), Jenni Romaniuk on better brand health
- John Fanning, Marketing.ie, Romaniuk's new book merits attention, August 2023
- Ehrenberg-Bass Institute, Brand health review: the workshop
- Madita Brandhorst, Research World (sponsored by quantilope), Better brand health tracking, June 2024
- Christopher Riquier and Byron Sharp, Image measurement and the problem of usage bias, EMAC Conference, 1997
- Jenni Romaniuk, Svetlana Bogomolova and Francesca Dall'Olmo Riley, Brand image and brand usage: is a forty-year-old empirical generalization still useful?, Journal of Advertising Research 52(2), 2012
- Kelly Vaughan, Virginia Beal and Jenni Romaniuk, Can brand users really remember advertising more than nonusers?, Journal of Advertising Research, 2016
- Shuba Srinivasan, Marc Vanhuele and Koen Pauwels, Mind-set metrics in market response models: an integrative approach, Journal of Marketing Research 47(4), 2010
- Dominique Hanssens, Koen Pauwels, Shuba Srinivasan, Marc Vanhuele and Gökhan Yildirim, Consumer attitude metrics for guiding marketing mix decisions, Marketing Science 33(4), 2014
- Koen Pauwels and Bernadette van Ewijk, Enduring attitudes and contextual interest, Journal of Interactive Marketing, 2020
- Florian Stahl, Mark Heitmann, Donald Lehmann and Scott Neslin, The impact of brand equity on customer acquisition, retention, and profit margin, Journal of Marketing 76(4), 2012
- Timothy Keiningham, Bruce Cooil, Tor Wallin Andreassen and Lerzan Aksoy, A longitudinal examination of Net Promoter and firm revenue growth, Journal of Marketing 71(3), 2007
- Robert Lavidge and Gary Steiner, A model for predictive measurements of advertising effectiveness, Journal of Marketing 25(6), 1961
- Rajarshi Chakravarty and N.N. Sarma, Evolutionary framework of hierarchy of effects models, Vilakshan XIMB Journal of Management 19(1), 2022
- Kevin Lane Keller, Conceptualizing, measuring, and managing customer-based brand equity, Journal of Marketing 57(1), 1993
- WARC, SWOCC Book of Brand Management Models: Brand Dynamics Pyramid (Millward Brown), 2006
- Research Live, Purchase behaviour in need of a rethink, says McKinsey (on Court, Elzinga, Mulder and Vetvik, The consumer decision journey), June 2009
- Kantar, What is the Meaningful Different and Salient framework?, July 2022
- Kantar, Brand Guidance
- Kantar, Kantar launches BrandDynamics, press release, May 2023
- Kantar, Brand tracking (BrandDynamics product page)
- Nigel Hollis, Kantar, Brands need to build more than just salience to grow, August 2020
- Ipsos, Brand health tracking and brand equity measurement
- Ipsos, Research tool builds better value for advertising and branding (Brand Value Creator), July 2012
- YouGov, BrandIndex
- Rachel Kennedy, Ehrenberg-Bass Institute, Why you won't find Ehrenberg-Bass talking about mass awareness
Last updated Oct 9, 2026


Marketing agency or growth system: when a company outgrows its agency
An agency is the right call while the founder still runs most of the company. Once the business starts copying itself into new locations or markets, it needs a system that sets goals, tests hypotheses and owns the result.

Why healthcare marketing agencies stall: the short, mid and long wins model we use with clinics
Most agencies own the click and nobody owns the front desk. How we structure clinic work in three horizons, the research behind each one, and one year of results.

The compliance layer under fintech marketing operations
A fintech marketing agency can build campaigns. It cannot own the compliance review, the KYC drop-off or the multi-market licensing rules that decide whether a lead ever becomes a customer.