SIPOC
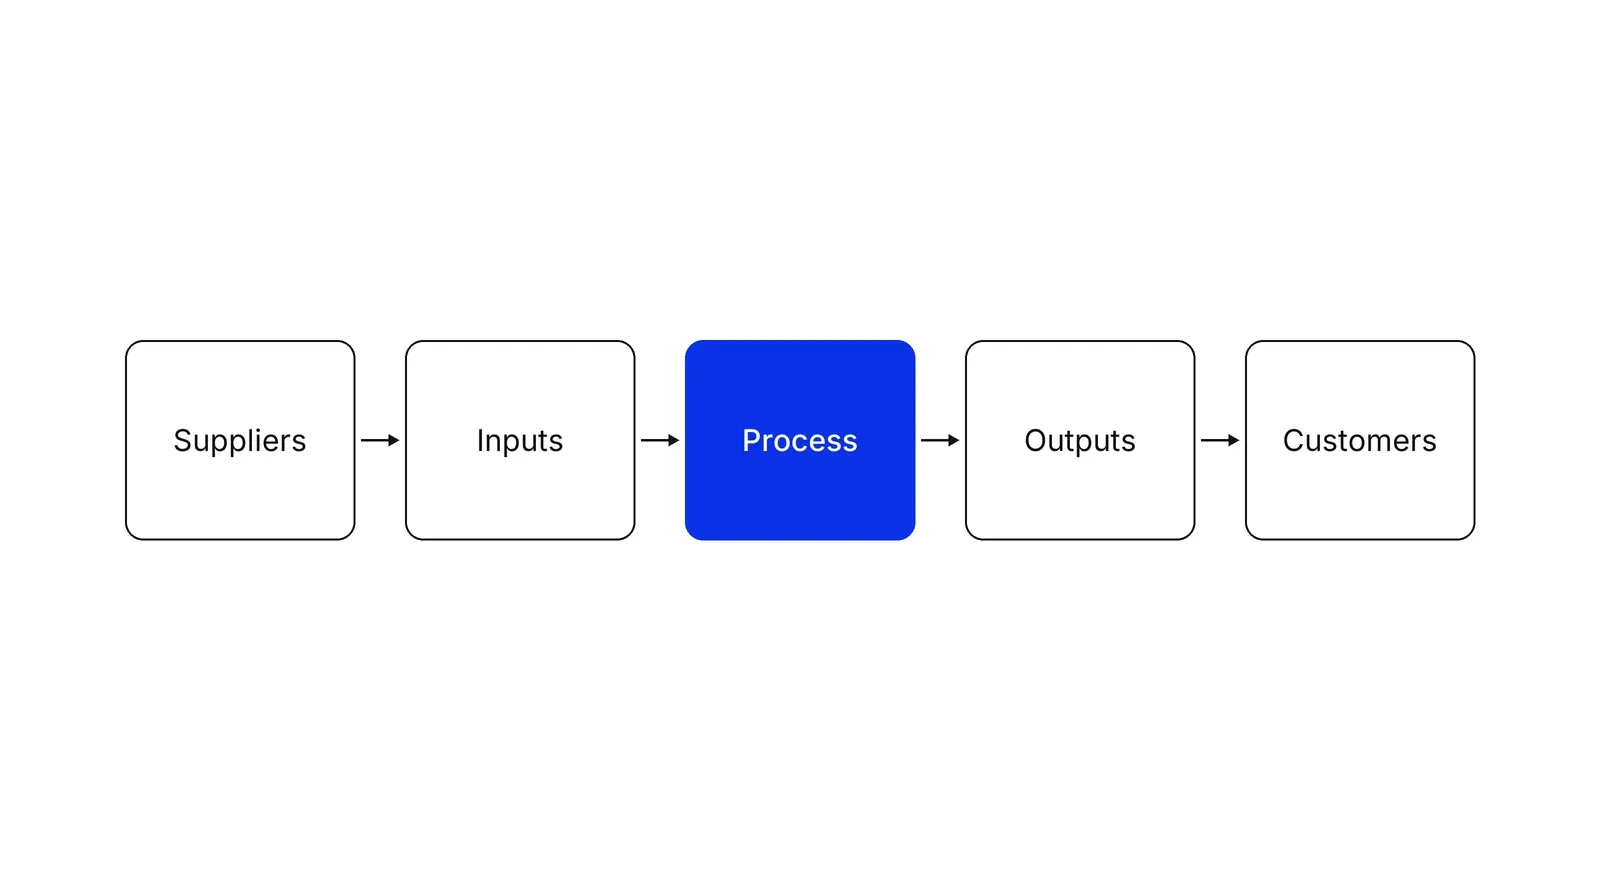
SIPOC is a one-page map of a process that lists its suppliers, inputs, process steps, outputs and customers, so a team agrees on scope before it draws anything detailed.
SIPOC is a one-page process map that lists the Suppliers, Inputs, Process steps, Outputs and Customers of a single process. Teams draw it at the start of an improvement project, before any detailed flowchart, to agree where the process starts and ends, who hands it what, and who receives the result. It comes from the quality management and Six Sigma tradition.
- Origin
- Not documented; quality management and Six Sigma practice, Late 1980s (secondary sources)
- Level
- 201 · Tool
- Fits
- Small and mid-size, Scale-up, Enterprise
- Time to apply
- 60 to 120 minutes for a first version with the people who run the process
- What you need
- one process with a clear owner, such as new-patient booking or lead handling · three to six people who do the work, including someone who receives its output · a wall or whiteboard and sticky notes in five colours or five columns
SIPOC is a one-page map of a process that lists its Suppliers, Inputs, Process steps, Outputs and Customers. ASQ, the American quality society, defines it as a data collection tool used by Six Sigma improvement teams, and says to use it first, when a team is beginning to investigate a process and before it builds a flowchart. The point is scope: who provides what, what the process does with it, what comes out and who gets it.
Its origin is murky. We found no primary document that names an inventor or a year. Secondary sources place it in the quality programmes of the late 1980s, and Six Sigma itself dates to Bill Smith’s 1986 work at Motorola on counting defects, according to iSixSigma. The idea underneath is older. W. Edwards Deming drew a flow diagram of production as a system, from suppliers through production to the consumer and back to design, in August 1950 at a conference with top management at the Hotel de Yama on Mount Hakone, Japan. He later said it was the spark that turned Japan around, and added that the same chart could fit a service organisation. It is an ancestor of the idea and carries no SIPOC columns.
AHRQ’s toolkit points readers to two reference works for the method: George and colleagues’ Lean Six Sigma Pocket Toolbook from McGraw-Hill, where SIPOC sits in the chapter on value stream mapping and process flow tools (pages 33 to 54), and Nancy Tague’s Quality Toolbox from ASQ Quality Press (2005). Neither gives a date of origin.
What are the five parts of a SIPOC?
Each column answers one plain question about a single process, and the process column carries the whole picture in four to seven steps. ASQ calls this a 35,000-foot view of the process, with detail left for the flowchart.
| Part | Question it answers | New-patient booking in a clinic |
|---|---|---|
| Suppliers | Who or what provides what the process needs? | Patient, ad platform, doctors’ calendars |
| Inputs | What does the process need to start? | Enquiry, phone number, free slots |
| Process | What are the main steps, in one line? | Answer, qualify, offer slots, confirm, remind |
| Outputs | What does the process hand over? | Booked slot, reminder |
| Customers | Who receives the outputs, and what do they need? | Patient, doctor |
ISO’s guidance defines a process as interrelated activities that use inputs to deliver an intended result, and notes that inputs and outputs can be intangible, such as data or knowledge. That matters for marketing and administration, where most inputs are information, not material.
In what order do teams fill it in?
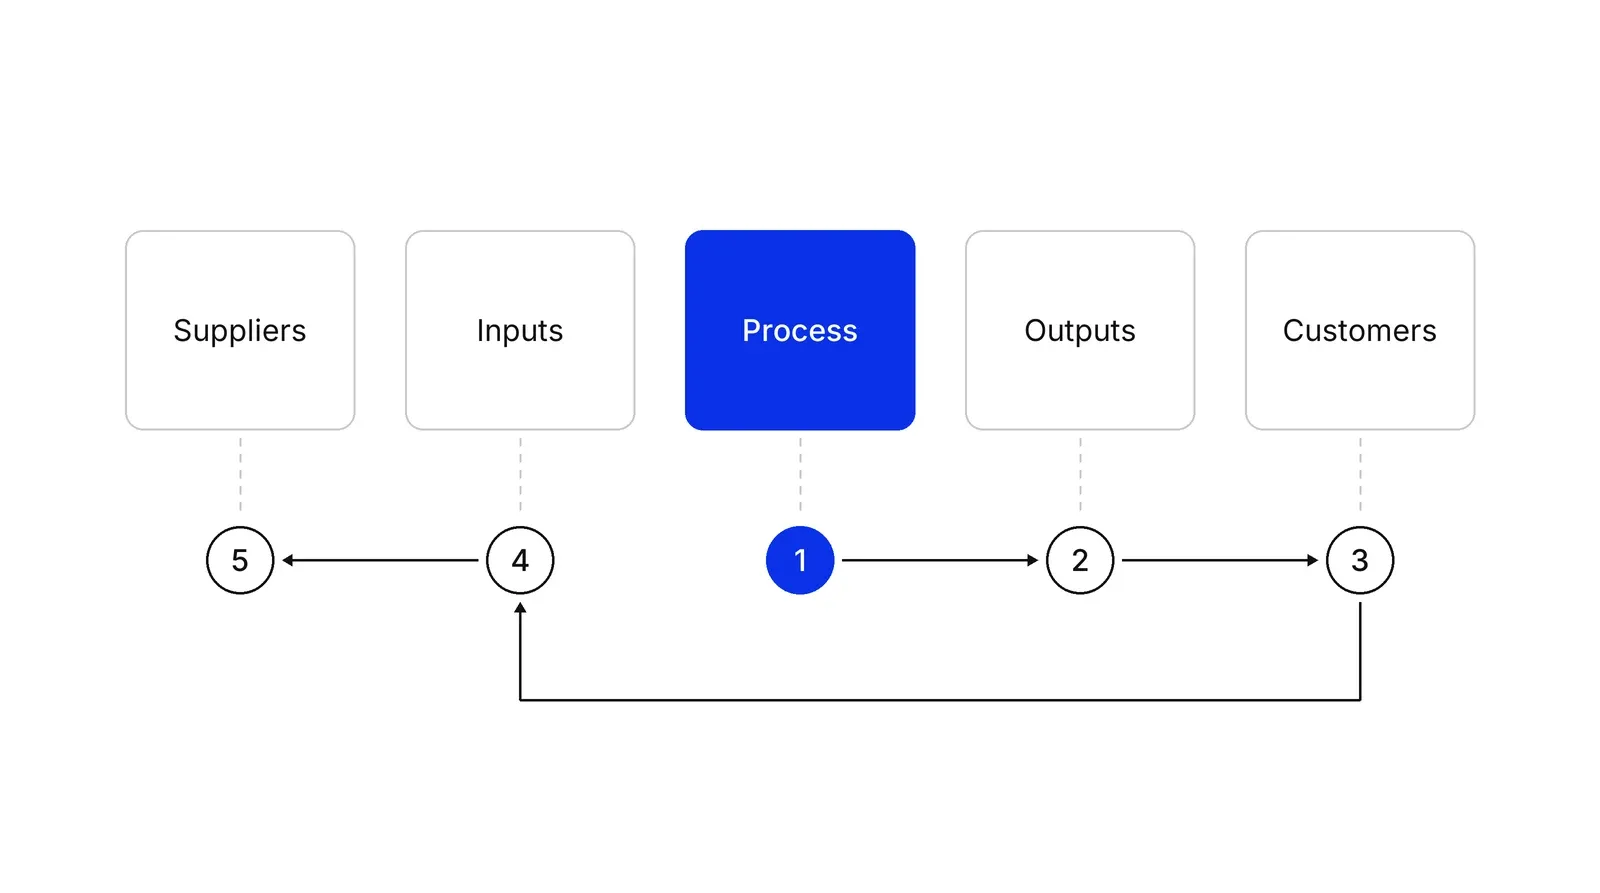
Teams usually fill it in a different order than it reads: process first, then outputs, customers, inputs and suppliers. Both iSixSigma (eight steps) and AHRQ (nine steps, on sticky notes and a flip chart) describe this sequence. Starting from the customer side keeps the page tied to who the work is for, and it stops the supplier column from turning into a list of every vendor the team has ever used.
The Institute for Healthcare Improvement’s QI Essentials Toolkit, which lists 9 tools and has no SIPOC among them, tells teams to draw the flowchart as the process actually works, not as it should work. National Highways, which publishes a SIPOC guide for project teams, keeps the kickoff meeting to 2 hours or less and asks for suppliers, customers and step owners in the room. The sources disagree on small points. ASQ describes five to seven core activities in the process column, while iSixSigma and National Highways say four or five. iSixSigma places SIPOC in the Measure phase of DMAIC, the five-phase Six Sigma cycle, but a 2021 hospital project in Karachi used it in Define, and ASQ’s own DMAIC page lists a value stream map under Define and a process map under Measure, without naming SIPOC. Treat the phase as a convention. ASQ also describes a variant, SIPOC+CM, that adds the constraints the process faces and the measures it uses.
SIPOC compared with other process maps
Pick the map by the question you are asking. ASQ calls the flowchart one of the seven basic quality tools, and SIPOC is not on that list. It is a scoping step that comes before them, and iSixSigma’s January 2025 example uses it to scope a medical bookkeeping application.
| Tool | Level of detail | Best for |
|---|---|---|
| SIPOC | One page, four to seven steps | Agreeing scope, customers and suppliers |
| Flowchart or BPMN model | Every step and decision | Finding rework and bottlenecks |
| Service blueprint | Customer actions and the staff and systems behind them | Designing a service experience |
| RACI matrix | Roles per task | Deciding who is responsible |
National Highways pairs the two: agree what is delivered and to whom with a SIPOC, then allocate responsibilities with a RACI matrix. When the problem is a cause rather than a scope, a fishbone diagram is the next tool, as ASQ’s fishbone page describes.
What does the evidence say?
The evidence shows SIPOC is widely used and rarely tested alone. A 2021 integrative review of lean tools in health care by de Barros and colleagues covered 33 studies. DMAIC appeared in 18 and SIPOC in 10, and its SIPOC studies include plastic surgery (Annals of Plastic Surgery), radiology (Journal of the American College of Radiology), military medicine (Military Medicine) and general clinical practice (Journal of Evaluation in Clinical Practice). The studies reported shorter waiting and cycle times and lower costs, but as results of whole projects. The review lists value stream mapping in 17 studies, the Ishikawa diagram in 9 and 5S in 7, so SIPOC sits in a toolkit and is not run alone. The Karachi project, by Tufail and colleagues at a 140-bed tertiary hospital in Sindh, Pakistan, used a SIPOC to flag four problems with patient flow during COVID-19, such as a reception and waiting area shared by all departments. It reported no numbers for the SIPOC step, though a Kano survey of 147 respondents ran beside it. A 2022 paper by Medjedovic and five co-authors on a gynecology and obstetrics outpatient clinic says SIPOC improved efficiency, but its authors also describe such use as limited so far.
DMAIC projects in clinics report gains without isolating one tool. A 2019 project by Carmel Davies and colleagues in the International Journal for Quality in Health Care, set in a private hospital day care unit, reported shorter patient turnaround times and more nursing care time, and its abstract does not mention SIPOC.
Mapping in general has a documented weakness. A 2021 systematic review by Antonacci and colleagues covered 105 healthcare studies. Most were quality improvement projects (68%), 65% came from the USA or UK and 86% appeared in 2010 or later (BMC Health Services Research). None met all ten quality criteria the authors defined, only 7% met eight or nine, and 15% involved patients. Maps came from multi-professional meetings in 45% of studies (Antonacci et al., BMC Health Services Research), stakeholders checked the map in 48%, and 42% described actions taken afterwards. The same group’s 2018 study of eight NHS projects reported eight benefits, led by a shared understanding of reality, and five success factors, including simple visuals and input from several stakeholders.
Outside health care, the record is thinner. Yeung’s 2009 paper applied SIPOC to customer satisfaction in a Hong Kong shoe shop and noted that earlier research seldom covered SIPOC in marketing management. We found no study that measures SIPOC on a marketing funnel, so its use there rests on practice, not proof.
Where it fits in marketing and clinic operations
In a marketing team, the customer column is where SIPOC pays off, because the customer of a lead process is usually sales, and sales has requirements. In a clinic, the doctor is a customer of the booking process. In both cases the page shows handoffs before anyone argues about performance. For a marketing team, it is a sensible first page of a marketing operational system.
How to apply SIPOC, step by step
- Name the process and its two edges. Write the process in one verb phrase, such as book a new patient, and decide the first and last event. IHI's flowchart guide asks teams to define the first and last step so that everyone shares the same boundaries. Result: a title and two boundary sentences on the board.
- Map four to seven high-level steps. List the main steps in the middle column, each a short verb phrase. Stay at the level of a summary, not a task list. Result: a middle column that fits on one line of sticky notes.
- List the outputs, then the customers. Write what the process hands over, then who receives it, including internal receivers such as the next team. Add what each customer needs from the output. Result: outputs and customers with one stated requirement each.
- List the inputs, then the suppliers. Write what the process needs to start, then who provides each item. Mark any input that regularly arrives late, wrong or incomplete. Result: inputs matched to named suppliers, with trouble spots flagged.
- Review with someone who was not in the room. Check for omissions, duplicates and unclear items, then show the page to the process owner or sponsor. Result: a corrected page and a short list of questions the team could not answer.
- Pick the next map. Decide which step or handoff needs a closer look and choose the tool: a detailed flowchart, a swimlane map or a root cause tool. Result: one named next step, with an owner and a date.
Examples
A clinic's new-patient booking
Illustrative, no real clinic implied. Process: from an enquiry arriving to the first visit being confirmed, in five steps (answer, qualify, offer slots, confirm, remind). Suppliers include the patient, the ad platform that sends the enquiry and the doctors who publish their calendars. Inputs are the enquiry, a phone number and calendar slots. Outputs are a booked slot and a reminder. Customers are the patient and the doctor. Writing it down often shows that the doctor is a customer of the booking process, which changes who should be asked about no-shows.
Marketing lead handling
Illustrative. Process: a form submission arrives, the lead is checked, routed to a salesperson and followed up. Suppliers are the ad platforms, the website and the data team. Inputs are the lead record and the campaign tag. The output is a qualified lead with a source, and the customer is sales. Sales is the customer, so its requirement, such as a phone number that works, goes on the page next to the output.
A fintech merchant payout
Illustrative. Process: a settlement file is produced, checked, sent to a bank and reconciled. Suppliers are the merchant's transactions, a compliance check and the bank. Inputs are the transaction list, fee rules and approval. Outputs are a payout and a reconciliation report. Customers are the merchant and the finance team. The map makes the approval step a visible input, so its delay can be measured later.
When to use it
Use it at the start of an improvement project when the scope is unclear, when several teams touch one process, or when nobody agrees who the customer of a step is. It also serves as a one-page briefing for a new process owner.
When not to use it
Skip it when the problem sits inside one step the team already knows, or when you need decision points and timing, which a flowchart or BPMN model shows. AHRQ's toolkit notes that SIPOC does not suit every process.
Common mistakes
- Drawing twenty process steps. Sources suggest four to seven; a longer list is a flowchart, not a SIPOC.
- Filling the columns left to right. Starting with suppliers produces a list of everyone the team has ever dealt with, instead of what this process needs.
- Listing only external customers. The next internal team that receives the output is often the one whose needs break the process.
- Building it alone from documentation. IHI and ASQ both say the people who do the work must draw the map, and it should show the process as it runs, not as it should run.
- Treating the page as the finished work. It scopes a project and finds no causes; a team still has to measure and test changes.
FAQ
What does SIPOC stand for?
SIPOC stands for Suppliers, Inputs, Process, Outputs and Customers. Suppliers provide the inputs, the process turns inputs into outputs, and customers receive the outputs. ASQ describes it as a data collection tool that Six Sigma teams use to gather information about all the elements of a process.
Who invented SIPOC?
We found no primary document that names an inventor or a year. Secondary sources place it in the quality management programmes of the late 1980s, and some credit Philip Crosby's process model. W. Edwards Deming's 1950 flow diagram of production as a system is an earlier relative, but it is not a SIPOC.
What is the difference between SIPOC and a flowchart?
SIPOC is a summary of a process and what flows in and out of it. A flowchart shows every step, decision and handoff in sequence. ASQ recommends using SIPOC before constructing a flowchart because it gathers the basic information about the process first.
How many steps should the process column have?
Sources disagree slightly. iSixSigma and National Highways advise four or five high-level steps, while ASQ describes five to seven core activities. In all three the aim is the same: a view high enough to fit on one page, with the detail left to a flowchart.
Can SIPOC be used outside manufacturing?
Yes. A 2021 review of lean tools in health care found SIPOC in 10 of 33 studies, and a 2009 paper applied it to customer satisfaction in a retail shop. Evidence for marketing and clinic administration is thin, so use it to scope work and measure the results separately.
Sources
- ASQ, SIPOC diagram (SIPOC+CM), Quality Glossary
- ASQ, Flowchart, Quality Glossary
- ASQ, DMAIC process, Quality Glossary
- ASQ, Fishbone diagram, Quality Glossary
- iSixSigma, Kerri Simon, SIPOC diagram, January 2025
- Agency for Healthcare Research and Quality, Workflow Assessment for Health IT Toolkit, SIPOC
- National Highways, Guide to SIPOC: suppliers, inputs, process, outputs, customers
- Institute for Healthcare Improvement, QI Essentials Toolkit: Flowchart
- Institute for Healthcare Improvement, Model for Improvement
- Muhammad Mutasim Billah Tufail et al., Implementation of lean Six-Sigma project in enhancing health care service quality during COVID-19 pandemic, AIMS Public Health 8(4), 2021
- Letícia Bianchini de Barros et al., Lean Healthcare Tools for Processes Evaluation: An Integrative Review, International Journal of Environmental Research and Public Health 18(14), 2021
- Edin Medjedovic et al., SIPOC method of optimizing the clinical process in obstetrics, Srpski medicinski casopis Lekarske komore 3(3), 2022
- Grazia Antonacci et al., Process mapping in healthcare: a systematic review, BMC Health Services Research 21, 2021
- Grazia Antonacci et al., The use of process mapping in healthcare quality improvement projects, Health Services Management Research, 2018
- Henry R. Neave, Day 9: A system of profound knowledge, quoting W. Edwards Deming on the 1950 flow diagram, 2022
- iSixSigma, Bill Smith, Six Sigma Hall of Fame
- ISO, The Process Approach in ISO 9001:2015
- Shirley Mo-Ching Yeung, Using Six Sigma: SIPOC for customer satisfaction, International Journal of Six Sigma and Competitive Advantage, 2009
- Carmel Davies, Lyons, Whyte, Optimizing nursing time in a day care unit: quality improvement using Lean Six Sigma methodology, International Journal for Quality in Health Care, 2019
- Michael L. George et al., The Lean Six Sigma Pocket Toolbook, McGraw-Hill, Open Library record
Last updated Oct 9, 2026


Fractional COO or embedded operations team? How to choose at Series A
The two models solve different problems: how to tell which one your company needs, and what each costs in time and control.

What operational systems successful fintech startups use: lessons from ten companies
Starling, Monzo, Qonto, bunq, Lunar, Pleo, Tide, Ramp, Mercury and Column scaled on four operating systems. Regulators' findings show what breaks when one of them lags behind growth.

What a revenue operations manager actually owns
Pipeline definitions, CRM hygiene, forecasting and the handoffs between marketing, sales and success. What the role covers, and how it differs from sales ops.