Competitive analysis matrix
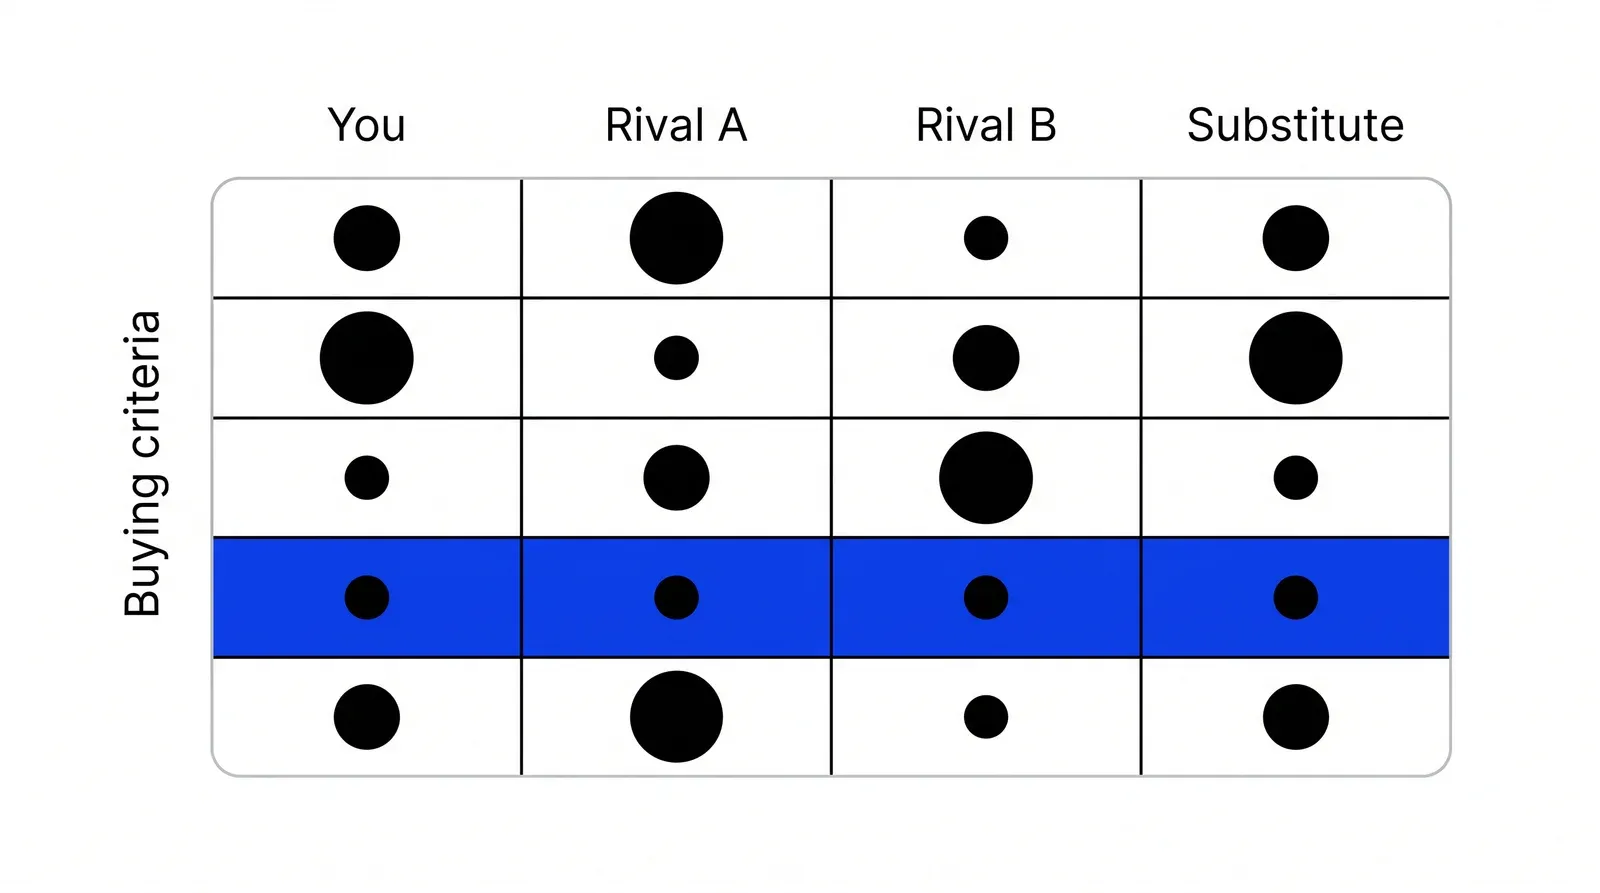
A competitive analysis matrix is a table that scores your company and three to five rivals on the same buying criteria, so you can see where you lead, where you trail and where nobody serves the customer well.
A competitive analysis matrix is a table that lists your company and three to five rivals in columns, the criteria buyers use to choose in rows, and a fact or score in every cell. It turns scattered impressions of competitors into one comparison, showing where you lead, where you trail and which needs no rival meets well.
- Origin
- Practice-based, no single inventor; grids of this kind spread through Porter's competitor analysis (1980), the House of Quality (Hauser and Clausing, 1988) and the strategy canvas (Kim and Mauborgne, 2002), 1980s onward; no single founding date
- Level
- 201 · Tool
- Fits
- Startup, Small and mid-size, Scale-up
- Time to apply
- two to four hours for a first version, refreshed each quarter
- What you need
- a short list of the rivals your buyers actually compare you with, from sales calls or lost deals · five to eight criteria buyers use to choose, taken from interviews, reviews or win-loss notes · public evidence for each cell: pricing pages, documentation, review sites, a trial account
A competitive analysis matrix is a table with your company and a handful of rivals across the top, the criteria buyers use to choose down the side, and a fact or a score in every cell. It is the most common shape a competitive analysis takes, because one page shows what a stack of notes cannot: where you lead, where you trail and which needs no one meets well.
Nobody invented it. Michael Porter’s 1980 book Competitive Strategy gave managers a chapter on how to study rivals systematically. Quality engineers built their own grids: John Hauser and Don Clausing’s 1988 Harvard Business Review article on the House of Quality made popular a chart where customers rate a product against competing products, one attribute at a time, and Stuart Pugh’s 1991 Total Design taught engineers to score design options against a reference. Robert Camp’s 1989 book turned benchmarking into a named practice. In 2002 W. Chan Kim and Renée Mauborgne turned the same rows into a line chart they called the strategy canvas. Shoppers saw the format even earlier: Consumer Reports, founded in 1936, built its name on testing products side by side.
Today the format is everywhere, from a startup’s investor deck to the vendor reports analysts sell. The Forrester Wave and the G2 Grid are both competitive matrices, one built from analyst scoring, the other largely from user reviews.
Who belongs in the columns
The columns should hold the three to five options a buyer actually weighs against you, plus one alternative that is not a direct competitor. Nielsen Norman Group recommends that “a typical competitive evaluation focuses on 2 to 4 competitors’ sites,” chosen from the rivals customers most often compare you with.
That matches how managers think. In Bruce Clark and David Montgomery’s 1999 Journal of Marketing study, as summarised by MIT Sloan Management Review, 57 managers named 6.46 competitors on average and saw only 3.07 of them as major. The risk is in what that short list leaves out. Mark Bergen and Margaret Peteraf argued in 2002 that the threats managers miss often come from firms outside the current product market, companies with the capabilities to enter. The US Small Business Administration makes the same point in plainer words and tells founders to list indirect or secondary competitors.
So one column should be the indirect option. For payroll software it is the accountant’s spreadsheet. For a clinic it might be the patient who waits and does nothing. Ming-Jer Chen’s 1996 test helps sort the rest: a real rival overlaps with you on customers and has similar resources, so a company that merely sells something nearby does not earn a column.
What goes in the rows
Rows are buying criteria: the reasons a customer picks one option over another. They should come from interviews, reviews and lost-deal notes, not from your product spec. Clayton Christensen and colleagues made the case in Harvard Business Review in 2016 that customers choose a product to get a specific job done, so the rows should describe that job: how fast, how cheap, how easy to start, how much support.
George Day and Robin Wensley warned in 1988 that judging advantage only from the competitor’s side, feature against feature, leaves you blind to what customers value. A feature checklist is the most common version of that mistake. Forrester’s own method gives the opposite rule: criteria should be “differentiating, rather than exhaustive.” Five to eight rows are usually enough. A row where every rival scores the same tells you nothing, so cut it.
How to score and weight the cells
Write a fact in each cell before you write a score. “Fee 0.8% per transfer” can be checked; “4 out of 5 on price” cannot, unless the fact sits next to it. Then give each row a weight from 1 to 3 by how much it drives the decision, and multiply.
Take a cross-border payouts startup comparing itself with two specialist rivals and a bank wire. This is an illustrative example; the scores are invented for the arithmetic.
| Criterion | Weight | You | Rival A | Rival B | Bank wire |
|---|---|---|---|---|---|
| Fee per transfer | 3 | 3 | 4 | 2 | 1 |
| Time to payout | 3 | 4 | 3 | 5 | 1 |
| Countries covered | 2 | 2 | 5 | 3 | 5 |
| Time to onboard | 2 | 4 | 2 | 3 | 1 |
| API quality | 1 | 3 | 4 | 5 | 1 |
| Weighted total (of 55) | 36 | 39 | 38 | 19 |
The totals say the startup is slightly behind. The rows say why: Rival A covers far more countries, and that row carries a weight of 2. The startup leads on onboarding time, and nobody else scores above 3 there. Those two rows are the conversation to have, and the total alone would have hidden both.
Reading the matrix without copying everyone
A matrix shows three kinds of rows. Rows where every column scores high are table stakes: you must be good enough, and being better rarely wins a deal. Rows where every column scores low are openings. Heavy rows where you trail are real gaps that cost you sales.
Kim and Mauborgne’s strategy canvas makes the pattern visible. Each column becomes a line across the competing factors, and in a crowded market the lines lie on top of each other.
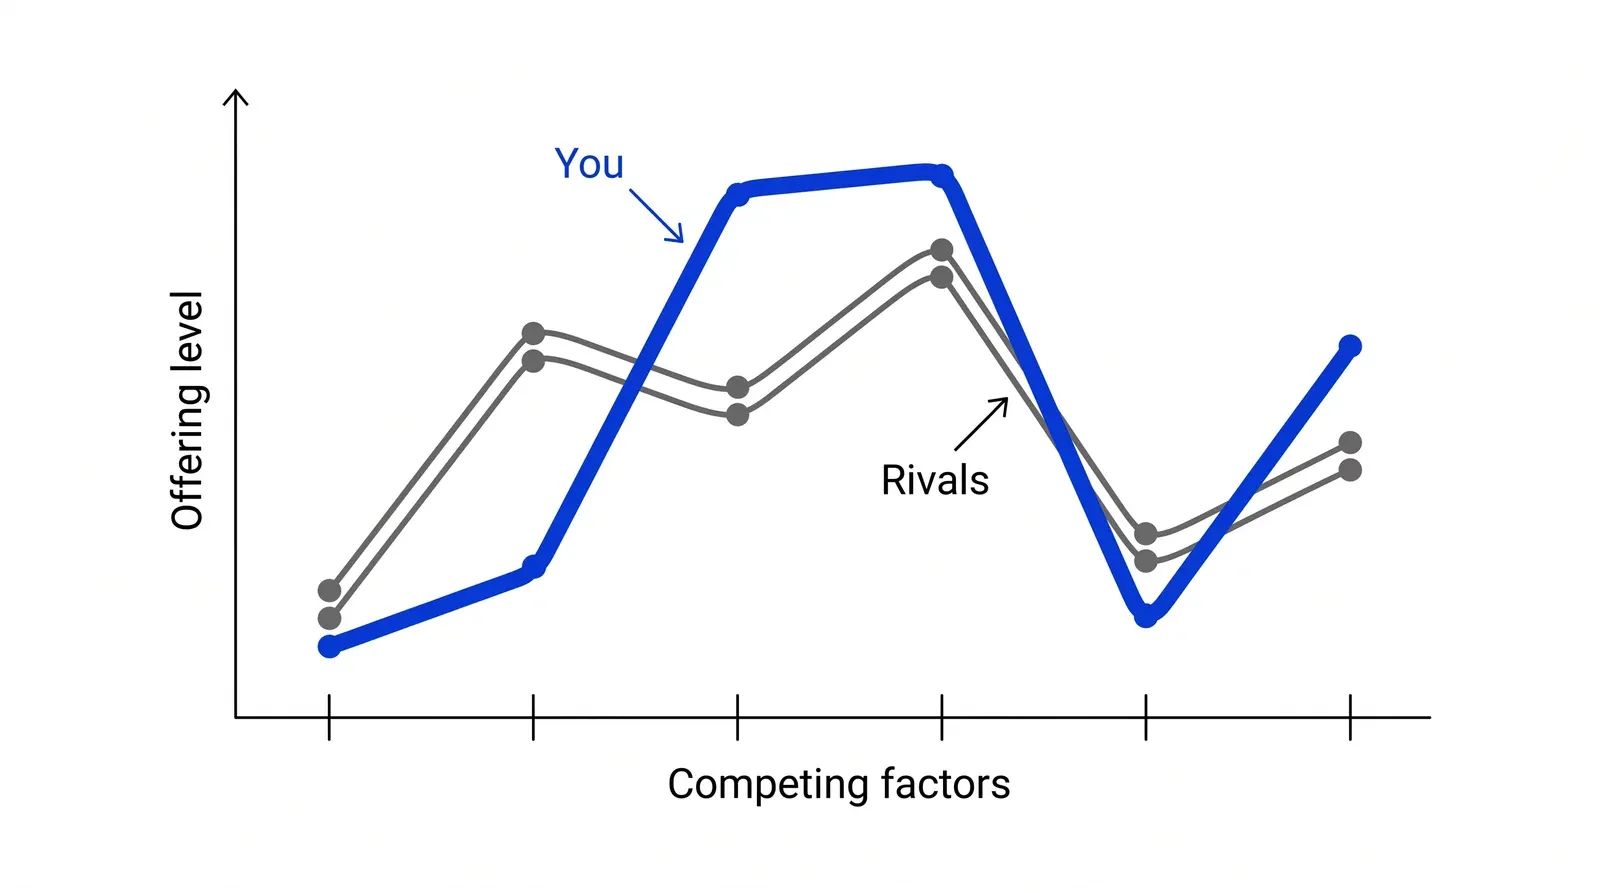
That overlap is the trap. Porter wrote in his 1996 article What Is Strategy? that “the more benchmarking companies do, the more they look alike.” Youngme Moon of Harvard Business School argued the same in her 2010 book Different, telling HBS Working Knowledge that competitive pressure “breeds conformity.” Edward Zajac and Max Bazerman showed in 1991 that managers have systematic blind spots about how rivals will respond, which makes closing every gap even riskier: rivals move while you copy.
So mark each trailing row with a decision. Close it if buyers leave over it. Stay behind on purpose if it costs too much and buyers forgive it. Or pick an empty row and make it yours, as the dental clinic in the examples below does with upfront prices.
Matrix, teardown, five forces or positioning map
The matrix is often confused with three related tools that answer different questions.
| Competitive analysis matrix | Competitor teardown | Porter’s five forces | Brand positioning map | |
|---|---|---|---|---|
| Looks at | Several rivals on the same criteria | One rival’s funnel, step by step | The structure of a whole industry | How buyers perceive brands on two attributes |
| Answers | Where you lead, trail, and where no one is good | What one competitor does and what to copy or beat | Whether the industry is worth competing in | Which perceived positions are crowded or open |
| Built from | Public facts, trials, reviews, buyer interviews | A real account and a full walkthrough | Evidence on rivalry, entrants, substitutes, buyers and suppliers | Customer surveys or interviews |
A common sequence: five forces to judge the industry, the matrix to compare the rivals inside it, and a teardown of the one rival that keeps winning the deals you lose. Inside a Growth Lab engagement, the matrix gets refreshed every quarter so the comparison reflects what rivals offer this quarter.
How to apply Competitive analysis matrix, step by step
- Pick three to five rivals. Take the names that come up in sales calls and lost deals, not the companies your team worries about most. Add one indirect alternative, such as a bank wire, a spreadsheet or doing nothing. The result is a column list a salesperson would recognise.
- Choose the buying criteria. Write down five to eight things buyers weigh when they choose: price, speed, coverage, support, ease of setup. Use the words buyers use in interviews and reviews. Drop anything every rival does equally well, since it will not separate anyone. The result is the row list.
- Weight each criterion. Give each row a weight from 1 to 3 by how much it drives the decision. Ask two or three recent customers to check the weights before you score anything. The result is an agreed view of what matters, written down before the scores can bias it.
- Fill every cell with evidence. For each rival and criterion, record a fact first (a price, a number of days, a feature present or missing) and then a score from 1 to 5. Note the source next to the score. The result is a matrix a colleague can audit and update.
- Read the rows, then the totals. Look for rows where everyone scores high (table stakes), rows where everyone scores low (an opening), and heavy rows where you trail. Only then look at weighted totals. The result is a short list of two or three gaps worth acting on.
- Decide and set a refresh date. Turn each gap into one decision with an owner: close it, stay behind on purpose, or compete on a different row. Put the next review in the calendar for one quarter out. The result is a list of decisions with names and dates.
Examples
A dental clinic against three nearby clinics
Illustrative, no real clinic implied. A clinic compares itself with two nearby practices and a chain branch on five criteria patients mention in reviews: first available appointment, price of a check-up, evening hours, parking and how clearly the price is quoted before treatment. Every clinic scores 2 out of 5 on quoting prices upfront, while the chain leads on evening hours. The clinic decides not to chase evening hours, which would need new staff, and to publish fixed prices for the five most common treatments, the one row where nobody in the area does well.
A B2B payroll software startup
Illustrative, no real company implied. A startup scores itself against two established payroll tools and the accountant's spreadsheet on six weighted criteria. The weighted totals are close: 41, 44, 39 and 27 out of 60. The rows tell more than the totals: both established tools score 5 on country coverage, where the startup scores 2, and every option scores 2 or lower on setup time. The team keeps coverage on the roadmap but makes a two-day setup the headline promise of its next campaign.
When to use it
Use it when you are entering a market and need one view of who does what, when sales keeps hearing the same three competitor names, before a pricing or positioning decision, or when an investor asks how you compare. It works best when you can name the rivals and when buyers choose on criteria you can observe from the outside.
When not to use it
Skip it when you have no real competitors yet and the question is whether the market exists at all; talk to buyers first. Skip it too when the question is how one rival wins customers step by step, where a teardown of their funnel answers better, or when you need to judge a whole industry's profitability, which is a five forces question.
Common mistakes
- Using your own feature list as the rows, which makes you look strong on things buyers never asked about.
- Scoring cells from memory or a rival's marketing claims instead of a price page, a trial account or customer reviews.
- Leaving out the indirect alternative, such as a spreadsheet or doing nothing, which is often the option you lose to most.
- Reading only the weighted total, which hides the one heavy row where you trail badly.
- Treating every row where you trail as a gap to close, until the product matches every rival and stands for nothing.
FAQ
What is a competitive analysis?
A competitive analysis is a structured look at the companies your buyers could choose instead of you: who they are, what they offer, what they charge and where they are strong or weak. A competitive analysis matrix is its most common format, a table of rivals against the buying criteria that decide a sale.
How do you do a competitive analysis step by step?
List three to five rivals that buyers really compare you with, including one indirect alternative. Choose five to eight buying criteria and weight them. Fill each cell with a sourced fact and a 1 to 5 score. Read the rows for gaps, then turn two or three gaps into decisions with owners.
What should a competitive analysis matrix include?
At minimum: rival names in columns, buying criteria in rows, a weight per criterion, a fact and a score in each cell, and the source of every fact. Many teams add pricing, target customer and market share rows, which the US Small Business Administration also lists among the basics.
How is competitive advantage analysis different from a matrix?
A matrix shows where you lead today. Competitive advantage analysis asks whether that lead can last. Jay Barney's 1991 test checks whether the resource behind it is valuable, rare, hard to imitate and hard to substitute. Run the matrix first, then test your two strongest rows against Barney's questions.
How many competitors should a matrix include?
Three to five columns plus your own. Nielsen Norman Group suggests two to four rivals for competitive usability work, and managers in Clark and Montgomery's 1999 study named about three major competitors on average. More columns than that usually means some rivals are not ones buyers actually compare.
Sources
- Michael E. Porter, Competitive Strategy: Techniques for Analyzing Industries and Competitors, Free Press, 1980, Internet Archive record
- Michael E. Porter, What Is Strategy?, Harvard Business Review, November-December 1996
- Ming-Jer Chen, Competitor Analysis and Interfirm Rivalry: Toward a Theoretical Integration, Academy of Management Review 21(1), 1996
- Mark Bergen, Margaret A. Peteraf, Competitor Identification and Competitor Analysis: A Broad-Based Managerial Approach, Managerial and Decision Economics 23(4-5), 2002
- Bruce H. Clark, David B. Montgomery, Managerial Identification of Competitors, Journal of Marketing 63(3), 1999
- Gregory Walker, Areti Kapelianis, Michael D. Hutt, Competitive Cognition, MIT Sloan Management Review, 2005
- Edward J. Zajac, Max H. Bazerman, Blind Spots in Industry and Competitor Analysis, Academy of Management Review, 1991, Kellogg School of Management record
- Shaker A. Zahra, Sherry S. Chaples, Blind Spots in Competitive Analysis, Academy of Management Executive 7(2), 1993
- George S. Day, Robin Wensley, Assessing Advantage: A Framework for Diagnosing Competitive Superiority, Journal of Marketing 52(2), 1988
- Jay Barney, Firm Resources and Sustained Competitive Advantage, Journal of Management 17(1), 1991
- John R. Hauser, Don Clausing, The House of Quality, Harvard Business Review, May 1988
- MIT OpenCourseWare, ESD.33 Systems Engineering, Assignment 3: Quality Function Deployment, Summer 2004
- W. Chan Kim, Renée Mauborgne, Charting Your Company's Future, Harvard Business Review, June 2002
- Blue Ocean Strategy, Strategy Canvas
- Harvard Business School Working Knowledge, When Other Companies Compete Like Crazy, Dare to Be Different (interview with Youngme Moon), April 2010
- Nielsen Norman Group, Tim Neusesser, Competitive Usability Evaluations, January 2024
- Forrester, The Forrester Wave Methodology
- G2, Research Scoring Methodologies
- US Small Business Administration, Plan your business: market research and competitive analysis
- Clayton M. Christensen, Taddy Hall, Karen Dillon, David S. Duncan, Know Your Customers' Jobs to Be Done, Harvard Business Review, September 2016
- Robert C. Camp, Benchmarking: The Search for Industry Best Practices that Lead to Superior Performance, Quality Press, 1989, Internet Archive record
- Stuart Pugh, Total Design: Integrated Methods for Successful Product Engineering, Addison-Wesley, 1991, Internet Archive record
- Consumer Reports, Our history
Last updated Oct 9, 2026


Marketing agency or growth system: when a company outgrows its agency
An agency is the right call while the founder still runs most of the company. Once the business starts copying itself into new locations or markets, it needs a system that sets goals, tests hypotheses and owns the result.

Why healthcare marketing agencies stall: the short, mid and long wins model we use with clinics
Most agencies own the click and nobody owns the front desk. How we structure clinic work in three horizons, the research behind each one, and one year of results.

The compliance layer under fintech marketing operations
A fintech marketing agency can build campaigns. It cannot own the compliance review, the KYC drop-off or the multi-market licensing rules that decide whether a lead ever becomes a customer.