Pareto principle (80/20)
The Pareto principle says a small share of causes produces a large share of results, so ranking causes by size shows where effort pays most; the 80/20 split is a rule of thumb, not a law.
The Pareto principle is the observation that a small share of causes, often about a fifth, produces a large share of the effect, such as most revenue from a few customers or most defects from a few causes. Teams rank causes from largest to smallest and act on the top ones first. The 80/20 split is approximate and changes with the data.
- Origin
- Vilfredo Pareto (income distribution law); Joseph Juran (the 'vital few' idea and the name), 1896 to 1897; late 1940s
- Level
- 201 · Tool
- Fits
- Startup, Small and mid-size, Scale-up, Enterprise
- Time to apply
- About 2 hours for a first Pareto analysis on data you already have
- What you need
- one result to explain, such as revenue, complaints, defects or support hours · that result broken down by cause, customer or product, over a fixed period · a spreadsheet that can sort and total
The Pareto principle is the observation that a small share of causes produces a large share of results. The usual shorthand is 80/20: about four fifths of the effect from about one fifth of the causes, such as most revenue from a fifth of customers or most defects from a fifth of defect types. Managers use it to decide where to look first. The exact split varies, and the evidence below shows it rarely lands on 80/20.
Where the idea comes from
Vilfredo Pareto, an Italian economist teaching at Lausanne, published a law of income distribution in his Cours d’économie politique in 1896 and 1897. Atkinson, Piketty and Saez write that he used tax tables from Swiss cantons and found that the top tail of incomes fits a power law. Persky’s review adds that he plotted cumulative incomes for England, Italian cities, German states, Paris and Peru on double logarithmic paper and got roughly straight lines with about the same slope. In volume 2 he takes a slope of 1.5 as a rough average.
A popular story says Pareto showed that 20% of Italians owned 80% of the land. We searched the scanned text of both volumes of the Cours and of the 1906 Manuale and found no such sentence, so we treat that story as unverified.
The name and the wider claim come from Joseph Juran. In his essay The Non-Pareto Principle; Mea Culpa, Juran says he first met Pareto’s work through a General Motors study of executive salaries. In the late 1940s, writing the first Quality Control Handbook, he needed a short name for the “vital few and trivial many” and chose Pareto’s. Later challenges made him read Pareto properly. He found that the work was about wealth and that its models were not meant for other fields. He also wrote that the cumulative curves in his handbook should have been credited to Max Lorenz, who published them in 1905. Juran’s own verdict: the name was a mistake and it stuck. His organization now uses the phrase “useful many” for the rest, because the tail still matters. The New York Times obituary still says he “created” the principle.
Why 80/20 is not a law
The split depends on the curve’s steepness, and 80/20 is one point on a family of curves. For a power law with slope k, the top fraction p of units holds a share p raised to the power (1 − 1/k). That follows from the formulas in Newman’s survey, which reports 86% for the richest fifth at one wealth exponent in his notation. With Pareto’s own average slope of 1.5, the top 20% hold about 58%, by our arithmetic. Getting 80% needs a slope of about 1.16.
Whether data follow a power law at all is a separate question. Clauset, Shalizi and Newman tested 24 datasets that had been claimed as power laws and found some consistent with the claim and others where it was ruled out. Gabaix argues that power laws are among the few solid quantitative regularities in economics, which is why each case still needs a test.
The two numbers in “80/20” also measure different things. One is a share of results and the other a share of units, so they have no reason to sum to 100. Sharp’s team calls the marketing version a 60/20 law.
What marketing studies measured
For customers, studies of a brand’s heaviest fifth of buyers give a range, summarized below. Sharp, Romaniuk and Graham report that a brand’s heaviest fifth of buyers brings about 59% of its yearly sales on average, from 68% in dog food to 44% in hair conditioner.
| Study | Window and data | Heaviest fifth of buyers’ share of sales |
|---|---|---|
| Sharp, Romaniuk, Graham 2019 | One year, grocery brands | 59% on average |
| Kim, Singh, Winer 2017 | Six years, US panel of over 100,000 households | Mean ratio 0.73 |
| McCarthy, Winer 2019 | 339 public non-grocery companies | 0.67 on average, 0.59 for subscription firms |
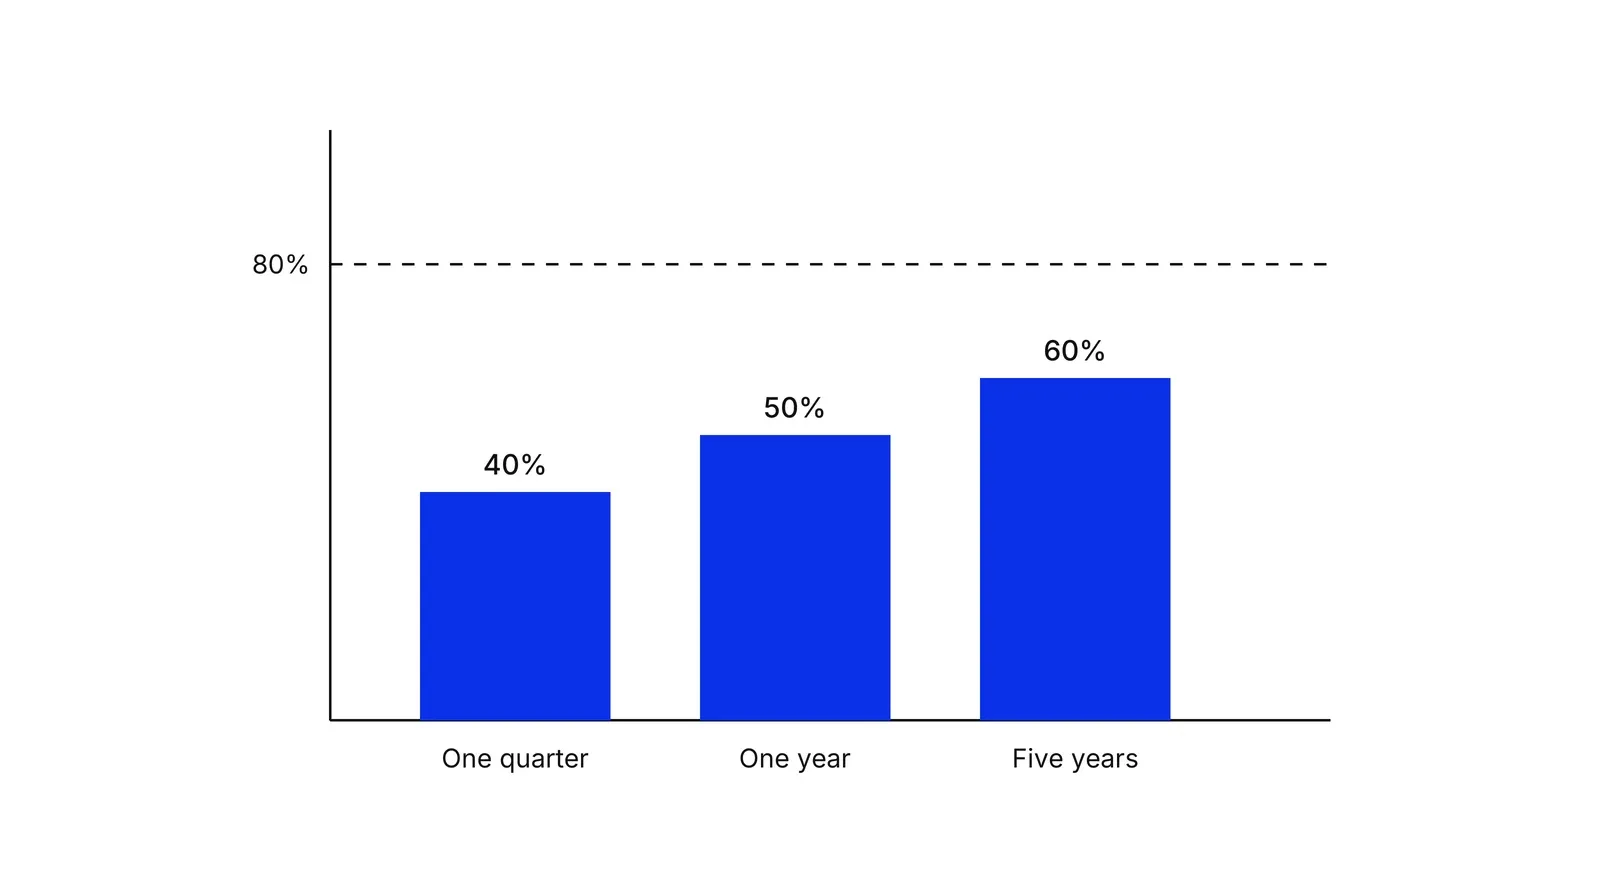
The window matters. A European panel across 22 grocery categories, which Sharp’s team summarizes, put the share at about 40% for one quarter, 50% for one year and 60% for five years.
Schmittlein, Cooper and Morrison argued in 1993 that measuring concentration correctly is harder than textbook 80/20 figures suggest. Brynjolfsson, Hu and Simester found that a retailer’s online sales were much less concentrated than its catalog sales, and that search and recommendation tools were linked to more niche sales. How Brands Grow covers Sharp’s critique in detail, including why heavy buyers drift back toward average.
Finding your vital few
A Pareto analysis ranks causes from largest to smallest, adds a running total and looks for the point where the line flattens. The Institute for Healthcare Improvement describes the resulting Pareto chart as a way to separate the vital few from the useful many, with small items grouped as “Other”. The Juran Institute notes an awkward zone where there is no clear breakpoint, and then suggests classifying the problem a different way.
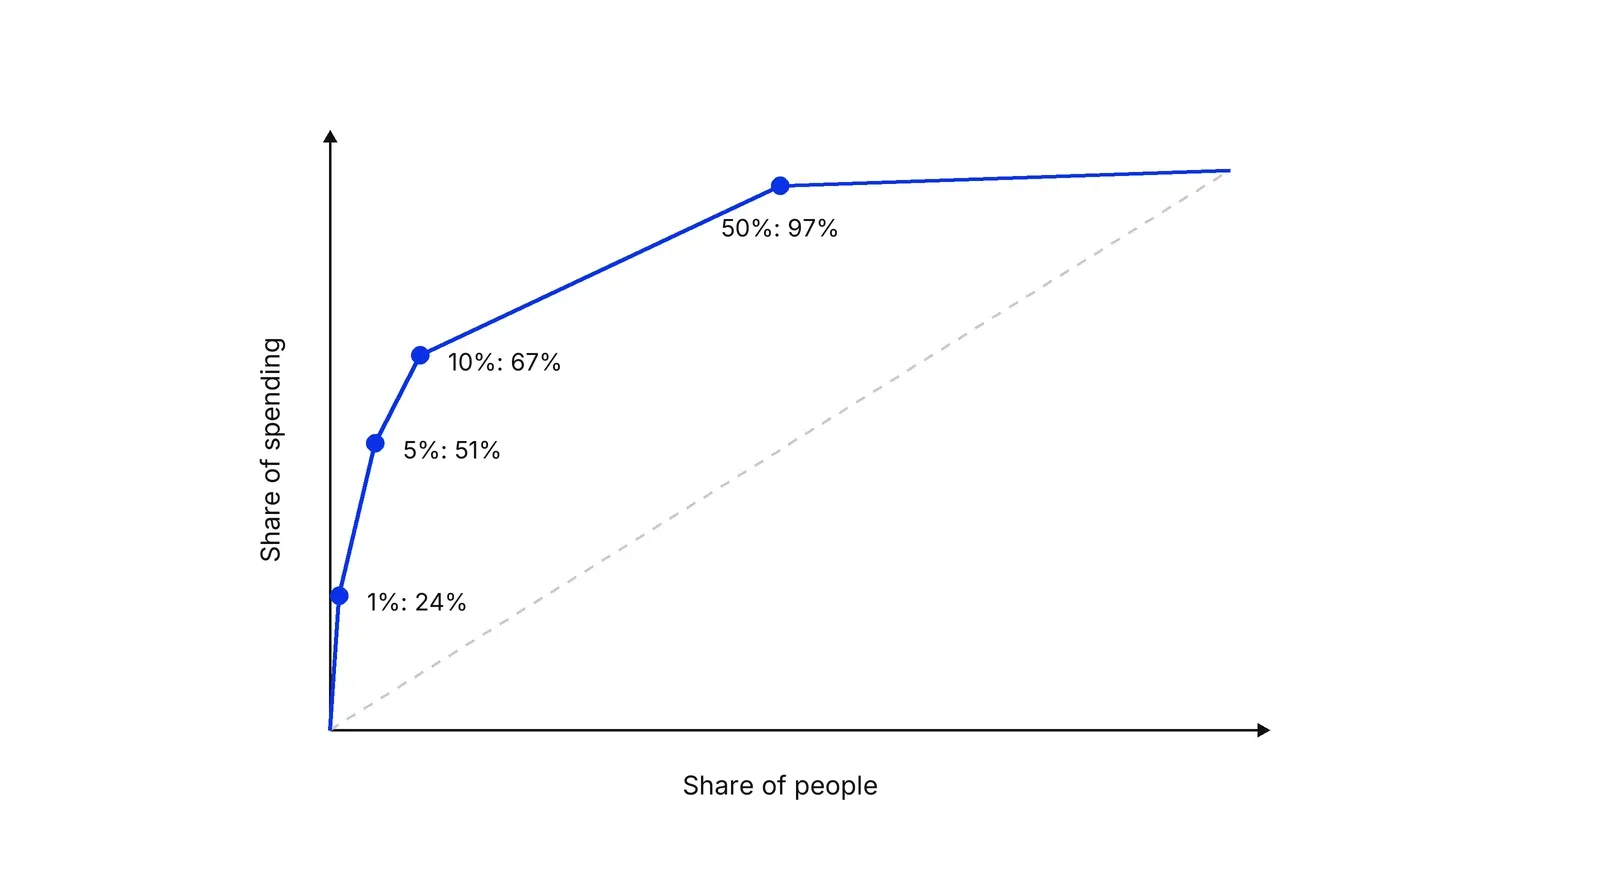
Real data can be steeper than 80/20. In 2021 the top 5% of people by spending accounted for 51.2% of US health expenditure, and the bottom half for 2.8%, according to the Agency for Healthcare Research and Quality.
Three other pages in this library help at specific points. A SIPOC map fixes the process boundaries first, so that categories such as “defect” mean the same thing in every row. RFM analysis ranks customers by recency, frequency and spend, which gives the ranked list a customer Pareto needs. Cohort analysis shows how a group’s contribution changes with age, which is the window effect above in another form.
A Growth Lab plan starts from the ranked list, then tests whether the top group holds on a second period.
How to apply Pareto principle (80/20), step by step
- Pick one result and one unit. Choose the outcome (revenue, refund cost, ticket count) and the unit you will rank (customer, product, defect type, process step). Mixing units hides the pattern. Result: one sentence such as 'share of monthly revenue by merchant'.
- Pull data for a fixed window. Take at least a full cycle of the business, and note the length. The share held by the top group changes with the window, so a quarter and a year will not match. Result: one table with a unit and a total per row.
- Rank and add up. Sort from largest to smallest and compute each row's share and the running total. Group the tiny rows as 'Other'. Result: the ranked list that a Pareto chart plots as bars plus a cumulative line.
- Find where the curve flattens. Mark the point after which each extra row adds little. That group is the vital few. If no clear break exists, Juran Institute calls it the awkward zone and suggests classifying the problem a different way. Result: a named group, whatever its size, with its share of the total.
- Check it on a second window. Repeat the ranking on another period or a different cut. Heavy buyers in one period are often lighter in the next, so a group that vanishes is a warning. Result: a decision on whether the vital few is stable enough to build on.
- Act on the top, watch the rest. Give the vital few an owner and a specific action: a retention plan, a fix for the top defect, a second supplier. Keep a light check on the long tail, since it can still carry a large share in total. Result: a short list of owned actions.
Examples
US health spending, 2021
Documented (AHRQ Statistical Brief 556, 2021 data). In 2021 the highest-spending hundredth of people accounted for 24.0 percent of US health expenditure, the top 5% for 51.2 percent, the top 10% for 66.9 percent and the bottom half for 2.8 percent. Spending is far more concentrated than 80/20 at the top, and the bottom half barely registers. A health plan that wants to cut cost per member starts with care management for the top few percent, not with the middle.
A payments processor ranking merchants
Illustrative arithmetic. A processor has 400 merchants and twenty million dollars of monthly volume. Ranked by volume, the top 80 merchants process about 14 million, which is 72 percent. The team could argue about 72 versus 80 for hours. The useful result is the list of 80 names: those accounts get a named manager and uptime alerts. A second check on a different quarter shows whether 60 of the 80 are still there.
A support team ranking ticket causes
Illustrative arithmetic. A team tags one thousand tickets into fifteen causes. Three causes hold 640 tickets, 64 percent. The Pareto chart shows a break after the third bar. Fixing the top cause, a confusing invoice email behind 250 of those tickets, removes a quarter of all volume. The remaining twelve causes go into a monthly review.
When to use it
Use it when you have more candidates than capacity: customers to serve, defects to fix, features to build, channels to fund. It works best on a measured result that has already been broken down by cause or unit, and as a first filter before a deeper method.
When not to use it
Skip it when the causes are few and equal, when the unit itself is badly defined, or when the tail carries risk. Rare failures can be the costly ones: a rare payment-fraud type may be the one that loses the license. Do not use 80/20 as a quota or a target. Never present it as a law of nature.
Common mistakes
- Quoting 80/20 without data. Sharp, Romaniuk and Graham (2019) find the heaviest fifth of a brand's buyers bring about 59 percent in a year, and the figure moves with the window.
- Assuming the two numbers must add to 100. They measure different things, so 60/20, 73/20 and 90/10 are all normal.
- Treating the vital few as permanent. Sharp's team reports that half of last year's heaviest buyers will not qualify for the top fifth next year.
- Ignoring the long tail. The lightest four fifths of a brand's buyers can still bring about two fifths of sales (Sharp et al., 2019).
- Ranking by the wrong measure. Revenue concentration and profit concentration can differ, and McCarthy and Winer (2019) report preliminary results with higher Pareto ratios for profit than for sales.
FAQ
What is the Pareto principle in simple words?
A few causes usually produce most of an effect. In business that means a small share of customers, products or defects accounts for most of the revenue, cost or trouble. The standard figure is four fifths of results from one fifth of causes, but that is a rule of thumb. Measure your own data to find the actual split.
Who invented the Pareto principle?
Nobody in a single step. Vilfredo Pareto described a power-law pattern in income in the 1890s. Joseph Juran generalized it to quality and management in the 1940s and named it after Pareto. Juran later wrote that the name was a mistake, since Pareto's work concerned wealth, but the name had already stuck.
Is the Pareto principle a law?
No. The split depends on the data and the time window. Pareto's own average exponent of 1.5 gives about 58% for the top fifth by our arithmetic, and marketing studies find 40% to 73% for the heaviest fifth of buyers. Many datasets sometimes called power laws fail statistical tests.
What is a Pareto chart?
A bar chart of causes sorted from largest to smallest, with a line showing the cumulative percentage. The Institute for Healthcare Improvement uses it to separate the vital few from the useful many, with small items grouped as 'Other'. The break in the line shows where focusing stops paying.
Does the Pareto principle apply to customers and marketing?
Roughly, yes, but the top fifth of customers usually brings less than 80%. Kim, Singh and Winer found a mean ratio of 0.73 over six years of US grocery data. McCarthy and Winer found 0.67 across public companies and 0.59 for subscription firms.
Sources
- Joseph M. Juran, The Non-Pareto Principle; Mea Culpa, 1974 (Juran Institute archive; printed in Quality Progress, 1975)
- Juran Institute, Pareto Principle (80/20 Rule) & Pareto Analysis Guide, 2019
- The New York Times, Joseph Juran, 103, Pioneer in Quality Control, Dies, 2008 (Internet Archive copy)
- Vilfredo Pareto, Cours d'économie politique, vol. 1, Lausanne, 1896 (Internet Archive scan)
- Vilfredo Pareto, Cours d'économie politique, vol. 2, Lausanne, 1897 (Internet Archive scan)
- Vilfredo Pareto, Manuale di economia politica, 1906 (Internet Archive scan)
- Econlib, Concise Encyclopedia of Economics, Vilfredo Pareto
- Alan Persky, Retrospectives: Pareto's Law, Journal of Economic Perspectives 6(2), 1992
- Anthony B. Atkinson, Thomas Piketty, Emmanuel Saez, Top Incomes in the Long Run of History, Journal of Economic Literature 49(1), 2011
- Max O. Lorenz, Methods of Measuring the Concentration of Wealth, Publications of the American Statistical Association 9, 1905 (History of Economic Thought profile)
- M. E. J. Newman, Power laws, Pareto distributions and Zipf's law, Contemporary Physics 46, 2005
- Aaron Clauset, Cosma Shalizi, M. E. J. Newman, Power-law distributions in empirical data, SIAM Review 51, 2009
- Xavier Gabaix, Power Laws in Economics: An Introduction, Journal of Economic Perspectives 30(1), 2016
- Byron Sharp, Jenni Romaniuk, Charles Graham, Marketing's 60/20 Pareto Law, Ehrenberg-Bass Institute report, 2019
- Baek Jung Kim, Vishal Singh, Russell S. Winer, The Pareto rule for frequently purchased packaged goods: an empirical generalization, Marketing Letters 28(4), 2017
- Daniel M. McCarthy, Russell S. Winer, The Pareto rule in marketing revisited: is it 80/20 or 70/20?, Marketing Letters 30(2), 2019
- David C. Schmittlein, Lee G. Cooper, Donald G. Morrison, Truth in Concentration in the Land of (80/20) Laws, Marketing Science 12(2), 1993
- Erik Brynjolfsson, Yu (Jeffrey) Hu, Duncan Simester, Goodbye Pareto Principle, Hello Long Tail, Management Science 57(8), 2011
- Agency for Healthcare Research and Quality, Statistical Brief 556: Concentration of Healthcare Expenditures, 2018-2021, March 2024
- Institute for Healthcare Improvement, QI Essentials Toolkit: Pareto Chart
- Institute for Healthcare Improvement, Quality Improvement Essentials Toolkit, 2017
Last updated Oct 9, 2026


Fractional COO or embedded operations team? How to choose at Series A
The two models solve different problems: how to tell which one your company needs, and what each costs in time and control.

What operational systems successful fintech startups use: lessons from ten companies
Starling, Monzo, Qonto, bunq, Lunar, Pleo, Tide, Ramp, Mercury and Column scaled on four operating systems. Regulators' findings show what breaks when one of them lags behind growth.

What a revenue operations manager actually owns
Pipeline definitions, CRM hygiene, forecasting and the handoffs between marketing, sales and success. What the role covers, and how it differs from sales ops.