Blue Ocean Strategy
Blue Ocean Strategy is a method for creating a new market space instead of fighting rivals for share, using the ERRC grid and the strategy canvas to cut costs and add new value at the same time.
Blue Ocean Strategy is a strategy method from INSEAD professors W. Chan Kim and Renée Mauborgne, set out in a 2004 Harvard Business Review article and a 2005 book. It tells companies to stop competing in crowded markets and create new demand instead. Its main tools are the strategy canvas, which maps how offers compare, and the ERRC grid: eliminate, reduce, raise, create.
- Origin
- W. Chan Kim and Renée Mauborgne, INSEAD, 1997 (value innovation); 2004 (HBR article); 2005 (book)
- Level
- 201 · Tool
- Fits
- Small and mid-size, Scale-up
- Time to apply
- two half-day workshops for a first strategy canvas and ERRC grid, then a few weeks of talking to noncustomers
- What you need
- a list of the 6 to 12 factors your industry competes on, such as price, range, speed or service · interviews with people who do not buy from your industry today, not only your customers · rough unit costs, so you can see what eliminating or reducing a factor would save
Blue Ocean Strategy is a method for growing by creating a new market space instead of fighting rivals for share of an existing one. W. Chan Kim and Renée Mauborgne, strategy professors at INSEAD, set it out in a 2004 Harvard Business Review article and in a book the following year. The core idea, value innovation, goes back to an HBR article they first published in 1997.
The authors’ site says the book draws on more than 150 strategic moves across 30 industries over 100 years and has sold over 4 million copies. INSEAD hosts a Blue Ocean Strategy Institute that the two co-direct. That reach is a reason to read its claims carefully.
Red oceans and blue oceans
A red ocean is an industry that already exists, where companies compete for known demand and the water turns red as margins fall. A blue ocean is a market that does not exist yet, described in the authors’ California Management Review paper as “untouched and uncontested.” In a blue ocean, demand is created rather than fought over.
| Red ocean | Blue ocean | |
|---|---|---|
| Market | Existing, known | New, not yet defined |
| Goal | Beat the competition | Make the competition irrelevant |
| Demand | Take share of existing demand | Create new demand |
| Value and cost | Trade one for the other | Pursue both at once |
The last row is the contested one. Michael Porter wrote in What Is Strategy? that “trade-offs are essential to strategy,” so a company picks low cost or differentiation. Kim and Mauborgne define value innovation as “the simultaneous pursuit of differentiation and low cost”. The page on Porter’s generic strategies covers the research on which view holds up.
The strategy canvas: seeing the market on one page
The strategy canvas is a chart that shows how every player in a market performs on the factors the industry competes on. The authors’ definition puts those factors on the horizontal axis and the level buyers receive on the vertical axis. Join the dots for one company and you get its value curve.
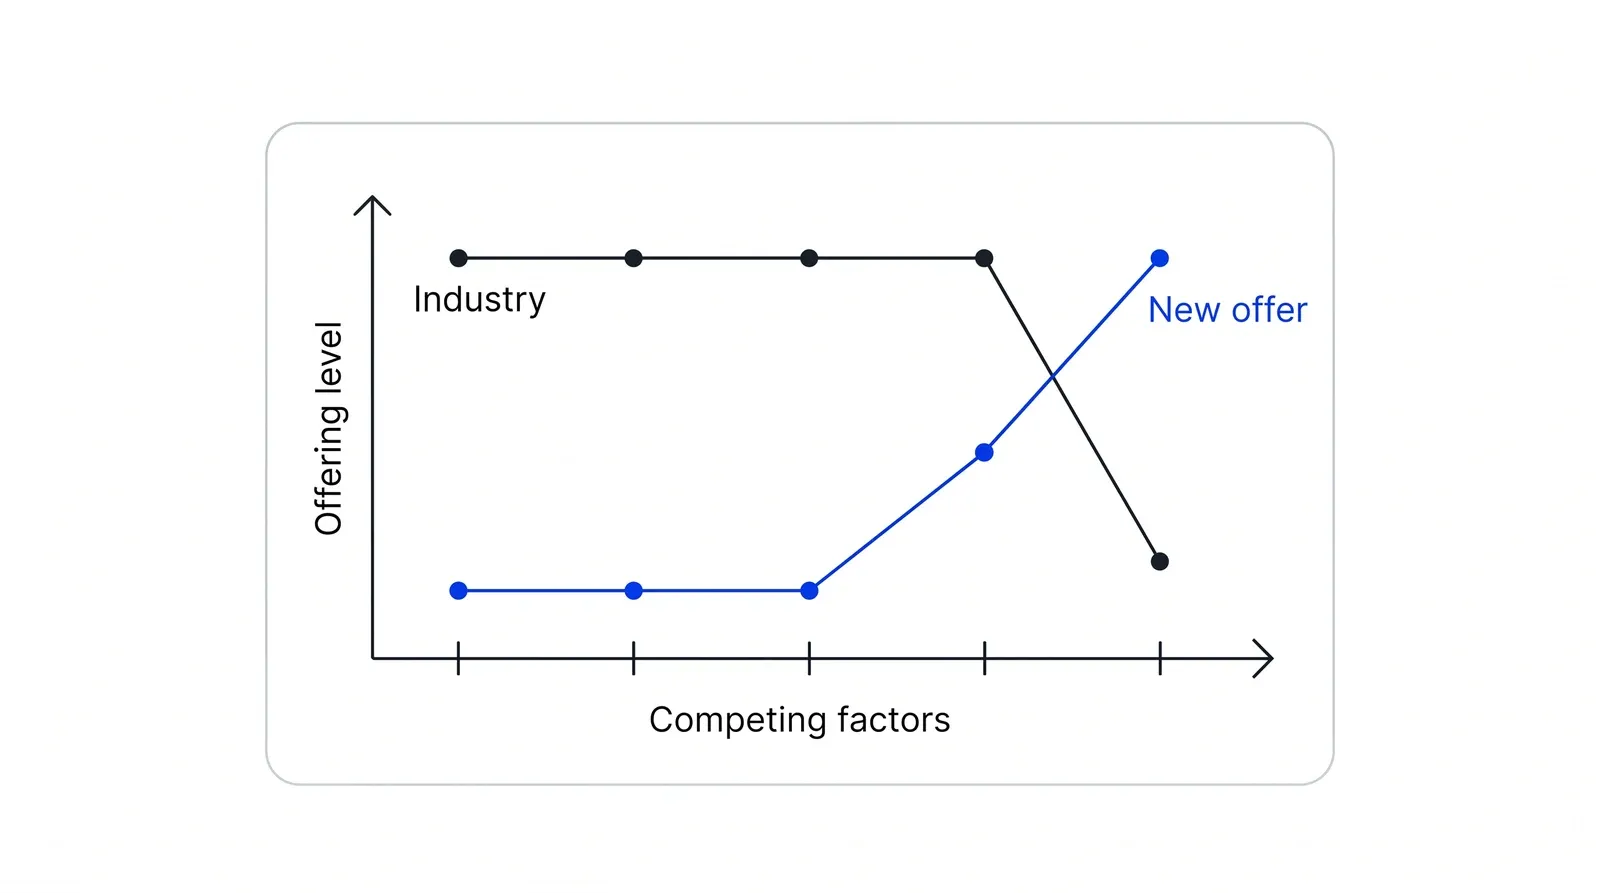
Take a payments company selling to small online shops. Its factors might be fee level, number of payment methods, onboarding speed, dashboard features and support hours. If the curves of all five rivals nearly overlap, the market is a red ocean, and one more feature will not change that for long. The canvas gets its own page in this library; here it is the before and after picture for the ERRC grid.
The ERRC grid: four actions on every factor
The ERRC grid is a four-box table that sorts each competing factor into one of four actions. The four questions, in the authors’ words:
- Eliminate: “Which factors that the industry has long competed on should be eliminated?”
- Reduce: “Which factors should be reduced well below the industry’s standard?”
- Raise: “Which factors should be raised well above the industry’s standard?”
- Create: “Which factors should be created that the industry has never offered?”
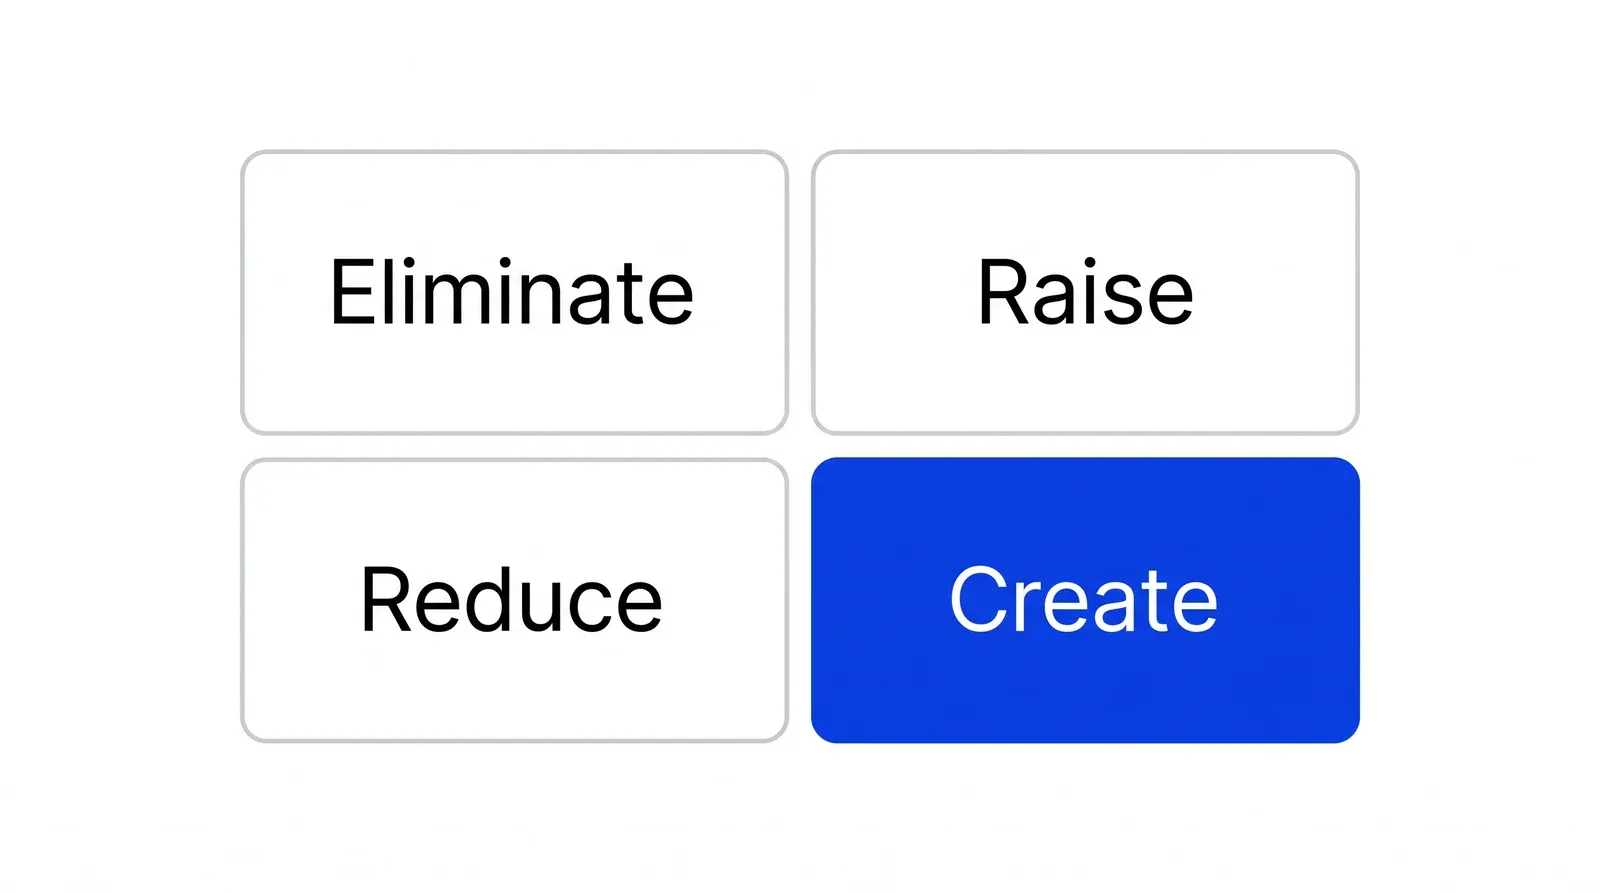
Eliminate and reduce lower your cost. Raise and create add value for buyers. The authors’ four actions framework says all four must be asked together, because a grid with only raise and create is a premium product with a premium cost, which is just a better-equipped red ocean player.
Where to look for a new market
The method adds tools for finding what to raise and create. The six paths framework tells you to look across alternative industries, strategic groups, buyer groups, complementary products, the functional or emotional appeal of the offer, and trends over time. The three tiers of noncustomers point you at people who buy reluctantly, people who refused your industry, and people who never considered it. Noncustomers matter because existing customers mostly ask for more of the same factors.
How the famous examples hold up
Cirque du Soleil and Yellow Tail wine are the two cases readers meet first. Both are reported by the authors, and both have later chapters the books do not cover.
Kim and Mauborgne’s 2004 article says Cirque grew revenue 22-fold in ten years in a declining industry. In June 2020 it sought creditor protection after pandemic closures. The authors’ INSEAD wine case says Yellow Tail sold about nine times its 25,000-case plan in its first US year, while Casella’s own site says over a million cases. Casella later posted a loss of about A$30 million for 2011-12 on a strong currency and loan write-downs. Neither episode disproves the method. They show that a blue ocean move is a point in time, which the authors accept: in a 2007 INSEAD interview they said rivals imitate and that failures are under-reported.
What the research says
The evidence is thinner than the book’s reach. Burke, van Stel and Thurik used Dutch retail data and found that blue ocean moves could stay profitable for long periods, and that blue ocean and competitive strategy overlap rather than exclude each other. Buisson and Silberzahn studied 24 innovation cases and concluded that neither being first, the blue ocean view, nor being a fast second explained who came to dominate a market.
Madsen and Slåtten treat the method as a management fashion: surveys show lower adoption than the volume of talk suggests. Agnihotri argues new markets also come from disruptive and frugal innovation, and that the strategy canvas is useful for any kind of innovation. A fair reading: the tools are good at showing a team where it looks like everyone else, and weaker as proof that a new curve will win.
How it fits with other tools
Use Porter’s five forces to see why your current market is a red ocean, then the strategy canvas and the ERRC grid to design a way out. In Pushers’ Growth Lab work, the canvas is a quick way to check whether a new offer differs from rivals before money goes into channels.
How to apply Blue Ocean Strategy, step by step
- Draw today's strategy canvas. List the factors your industry competes on along the bottom and score your offer and two or three rivals on each, from low to high. Join the dots into value curves. Result: one chart that shows whether everyone in your market is offering the same thing.
- Talk to noncustomers. Interview people who buy a substitute or nothing at all: those about to leave, those who refused your industry, and those who never considered it. Ask what puts them off. Result: a short list of reasons people stay away, in their own words.
- Fill the ERRC grid. Sort every factor into eliminate, reduce, raise or create. Use the noncustomer reasons to decide what to raise and create, and your cost data to decide what to cut. Result: a grid with at least one entry in each box.
- Draw the new value curve. Plot the ERRC choices on the same canvas as the industry. A good curve has focus, departs clearly from rivals and can be described in a short tagline. Result: a new curve plus one sentence a customer would understand.
- Check the economics. Set the price the mass of target buyers can pay, then work back to the cost that leaves a margin. If the cuts from eliminate and reduce do not cover the cost of raise and create, go back to the grid. Result: a price and target cost that both work.
- Test small and plan for imitation. Run a pilot with one segment or one location before a full launch, and list which parts rivals could copy fastest. Result: evidence that noncustomers buy, and a note of what you will do when the copies arrive.
Examples
Cirque du Soleil, as the authors tell it
According to Kim and Mauborgne's 2004 Harvard Business Review article, Cirque du Soleil was founded by street performers in 1984. They report that its revenue grew 22-fold over ten years while the circus industry declined, and that it reached in about 20 years revenues Ringling Bros. took more than a century to reach. Their site says Cirque targeted adults and corporate clients at prices several times those of a traditional circus. The later record is less tidy. According to Reuters, Cirque sought creditor protection in June 2020 after COVID-19 closures left it with no revenue and about 95% of its staff laid off. The pandemic, not the strategy, triggered that filing, but it shows that a blue ocean gives no protection against a shock that closes the whole category.
Yellow Tail wine, and the parts the story leaves out
According to Kim and Mauborgne, Casella Wines launched Yellow Tail in the US in July 2001 and created three factors, easy drinking, easy to select and fun and adventure, while cutting the rest of the industry's usual factors. According to their INSEAD case, it planned about 25,000 cases for the first year and sold roughly nine times that, reaching about 25 million cases by the end of 2005. According to Casella's own site, over 1 million cases sold in the first year, so the published figures do not agree. Volume did hold up, but according to The Area News and Shanken News Daily, Casella posted a loss of about A$30 million for 2011-12, its first in two decades, blaming the strong Australian dollar and loan write-downs, while the US price stayed steady. A low-price blue ocean leaves little room when costs or currencies move.
A dermatology clinic using the ERRC grid
Illustrative, no real clinic implied. Clinics in a city compete on doctor reputation, treatment range, premium interiors and long consultations. Many people with mild acne never book, because a visit means a waiting list and a high fee. One clinic eliminates the premium interior and walk-in cosmetics, reduces the first consultation to 15 minutes with photos uploaded in advance, raises follow-up frequency through messages, and creates a fixed monthly price for a 12-week plan. If a 45-minute consultation is replaced by a 15-minute one, each doctor can see three times as many first visits per day, which is what makes the lower price work.
When to use it
Use it when your market looks crowded and everyone offers the same thing, when growth now comes only from price cuts and promotions, or when a large group of people needs what your industry provides but does not buy it. It also works as a workshop tool for leadership teams who argue about features, because the strategy canvas shows the whole picture on one page.
When not to use it
Skip it when you have not found product-market fit, when your advantage depends on scale or regulation rather than on a new value curve, or when you need a quick fix to a sales problem. It also gives little help with execution once the new curve is chosen, and it is not a substitute for checking whether the new market is big enough.
Common mistakes
- Filling only the raise and create boxes. Without eliminate and reduce there is no cost advantage, and the result is a premium product, not a new value curve.
- Interviewing only current customers, who mostly ask for more of what the industry already offers. The new demand is among noncustomers.
- Treating a niche or a new technology as a blue ocean. The authors argue the test is a leap in buyer value at a lower cost, not novelty.
- Assuming a blue ocean stays blue. The authors say rivals imitate successful moves, so plan the next move before the copies arrive.
- Treating famous examples as proof. The best-known cases are told by the method's authors, who say themselves that failures are under-reported.
FAQ
What is the difference between a red ocean and a blue ocean?
A red ocean is an existing industry where companies fight for a share of known demand and choose between differentiation and low cost. A blue ocean is market space that does not yet exist, where demand is created and competition is irrelevant at first. Kim and Mauborgne argue the second needs both differentiation and low cost at once.
What are the four actions of the ERRC grid?
Eliminate factors the industry takes for granted, reduce factors well below the industry standard, raise factors well above it, and create factors the industry has never offered. The first two lower cost and the last two add value. The authors insist all four questions are asked together.
What is a strategy canvas in Blue Ocean Strategy?
It is a one-page chart with the factors an industry competes on along the horizontal axis and the level each player offers on the vertical axis. Joining the dots for each company gives its value curve. If all curves look alike, the market is a red ocean and the canvas shows where to break away.
Is Blue Ocean Strategy still relevant?
INSEAD still runs an institute dedicated to the method, and the tools work well as a workshop format. The evidence is mixed: a Dutch retail study found blue ocean moves can stay profitable for long periods, while a 2019 review found actual use by companies lower than the attention around the method suggests.
What is the main criticism of Blue Ocean Strategy?
Critics say its guidance on implementation is vague and its view of markets too simple, and that being first into a new market does not decide who wins it. Buisson and Silberzahn's study of 24 innovations found neither first movers nor fast followers explained who came to dominate a market.
Sources
- W. Chan Kim, Renée Mauborgne, Blue Ocean Strategy, Harvard Business Review, October 2004
- W. Chan Kim, Renée Mauborgne, Value Innovation: The Strategic Logic of High Growth, Harvard Business Review (republished July-August 2004)
- Harvard Business Review Store, Value Innovation: The Strategic Logic of High Growth, OnPoint edition (originally published 1997)
- W. Chan Kim, Renée Mauborgne, Blue Ocean Strategy: From Theory to Practice, California Management Review 47(3), 2005
- Blue Ocean Strategy (Kim and Mauborgne), What Is Blue Ocean Strategy
- Blue Ocean Strategy (Kim and Mauborgne), ERRC Grid
- Blue Ocean Strategy (Kim and Mauborgne), Strategy Canvas
- Blue Ocean Strategy (Kim and Mauborgne), Four Actions Framework
- Blue Ocean Strategy (Kim and Mauborgne), Value Innovation
- Blue Ocean Strategy (Kim and Mauborgne), Six Paths Framework
- Blue Ocean Strategy (Kim and Mauborgne), Three Tiers of Noncustomers
- Blue Ocean Strategy (Kim and Mauborgne), Buyer Utility Map
- Blue Ocean Strategy (Kim and Mauborgne), Strategy Canvas Examples
- Blue Ocean Strategy (Kim and Mauborgne), Cirque du Soleil
- W. Chan Kim, Renée Mauborgne et al., Crafting Winning Strategies in a Mature Market (US wine industry, 2001), INSEAD case, 2009
- strategy+business, Stuart Crainer, W. Chan Kim and Renée Mauborgne: The Thought Leader Interview, 2002
- INSEAD Knowledge, In search of blue oceans, September 2007
- INSEAD, Blue Ocean Strategy Institute
- Andrew Burke, André van Stel, Roy Thurik, Blue Ocean versus Competitive Strategy: Theory and Evidence, ERIM Report, 2009
- Andrew Burke, André van Stel, Roy Thurik, Blue Ocean vs. Five Forces, Harvard Business Review 88(5), 2010
- Dag Øivind Madsen, Kåre Slåtten, Examining the Emergence and Evolution of Blue Ocean Strategy through the Lens of Management Fashion Theory, Social Sciences 8(1), 2019
- Bernard Buisson, Philippe Silberzahn, Blue Ocean or Fast-Second Innovation? A Four-Breakthrough Model, International Journal of Innovation Management 14(3), 2010
- Arpita Agnihotri, Extending Boundaries of Blue Ocean Strategy, Journal of Strategic Marketing 24(6), 2016
- Martin Sposato, The Blue Ocean Strategy: Strategic Innovation or Management Fad?, Advances in Business and Management 25, 2025
- Michael E. Porter, What Is Strategy?, Harvard Business Review, November-December 1996
- Al Jazeera (Reuters), Showstopper: Cirque du Soleil files for bankruptcy protection, 30 June 2020
- The Area News, Casella posts record loss but jobs safe, says boss, December 2012
- Shanken News Daily, Yellow Tail producer Casella secures funding as Aussie dollar weakens, July 2013
- Casella Family Brands, Yellow Tail
Last updated Oct 9, 2026


Marketing agency or growth system: when a company outgrows its agency
An agency is the right call while the founder still runs most of the company. Once the business starts copying itself into new locations or markets, it needs a system that sets goals, tests hypotheses and owns the result.

Why healthcare marketing agencies stall: the short, mid and long wins model we use with clinics
Most agencies own the click and nobody owns the front desk. How we structure clinic work in three horizons, the research behind each one, and one year of results.

Why channel tests stall after month three
Most paid channel tests do not end with a decision. They end when the budget runs out, the attribution model changes, or everyone quietly stops looking at the dashboard.