Original research as content
Original research as content is the practice of publishing data nobody had before, from a survey, your own records or a new analysis of public data, with its method, so that others cite you as the source.
Original research as content means collecting or analysing data that did not exist before, such as a customer survey, an analysis of your own records or a new cut of public data, and publishing the findings together with the method. It turns a company into a primary source that journalists, writers and AI answers can cite, provided readers can judge how the numbers were made.
- Origin
- No single originator; the practice borrows its standards from survey research (Pew Research Center, AAPOR) and from company research reports, no agreed date
- Level
- 301 · Advanced
- Fits
- Small and mid-size, Scale-up
- Time to apply
- about one quarter for a first study, from question to published report
- What you need
- one question your buyers or the press care about, which no published source answers · access to data: your own records, a customer list, a panel or a public dataset · someone who can analyse data and explain the method · a privacy check by whoever owns data protection
Original research as content is the practice of producing data that did not exist before, such as a survey, an analysis of your own records or a new cut of public data, and publishing it with its method so that others can cite you as the source. A statistics roundup repeats other people’s numbers. A study adds one. Google’s guidance for helpful content asks whether a page provides “original information, reporting, research, or analysis”, and a study is the clearest way to say yes.
Four ways to get data nobody else has
Most studies come from one of four sources. The choice decides the main risk you have to manage.
| Source | Example | Main risk |
|---|---|---|
| Survey of customers or a panel | A payments firm asks 300 finance managers how they pay suppliers | Careless or unrepresentative respondents |
| Your own records | A clinic group studies anonymised appointment data | Privacy and re-identification |
| Public or purchased data, analysed anew | Ahrefs studied pages in its own index | Bias in the source itself |
| Experiment or test | A controlled test of two email subject lines | A small effect from a single run |
The third row shows the risk clearly. In its 2023 study of about 14 billion pages, Ahrefs found that 96.55% of pages in its index get no Google traffic, and stated that the index leans toward the quality side of the web. The finding is useful because the limit comes with it.
What the evidence says about payoff
The evidence that studies pay off is thin, and most of it comes from vendors’ own surveys.
Orbit Media’s 2026 survey of 1,042 marketers says fewer marketers now publish research, and that publishing it raises the likelihood of strong blog results by 50%. The page gives no baseline, the answers are self-reported and the survey comes from an agency. The same survey puts the overall share reporting strong results at 13.9%. Treat the 50% as a direction, not a forecast.
For AI answers, the closest academic test is the GEO paper by Aggarwal and colleagues (KDD 2024). It added statistics, quotations or citations to existing source text and measured visibility in generative engine answers on a benchmark of 10,000 queries (see the paper). The top methods gained 30% to 40% on one measure and 15% to 30% on another. It did not test original studies or search rankings. Google says there are no extra requirements for AI Overviews or AI Mode.
A reporter’s coverage may matter more. Muck Rack’s analysis of more than 25 million links cited by ChatGPT, Claude and Gemini found that earned media made up about 84% of them, with journalism at 27%. That suggests a study that wins press coverage can reach AI answers by that route, though the data does not show it for studies specifically.
Figures on how often studies earn links circulate widely. None that traced back to a primary report with a stated sample and year appear here.
Why a reporter picks up a number
Whether a writer covers your finding depends on news values, the criteria editors use to judge a story. Harcup and O’Neill tested the standard list against a new content analysis of UK news and proposed an updated list that accounts for social media in 2017. In practice, pitch a finding, not a report: one sentence that says what is new, with the sample size and dates beside it.
Reporters also check the basics. The Journalist’s Resource primer says a sample can be generalised only if it is representative of the population, and that volunteers who choose to join a study may not resemble that population. A study of your own newsletter readers describes your readers. Say so.
For the link side of the work, see link building and digital PR. For where a study fits in an authority programme, see thought leadership.
What makes the numbers credible
Credible research shows its working. AAPOR’s Transparency Initiative asks members to disclose 12 elements, among them who sponsored and conducted the work, the questionnaire, the dates, the number of completes, weighting, data exclusions, limitations and any use of AI.
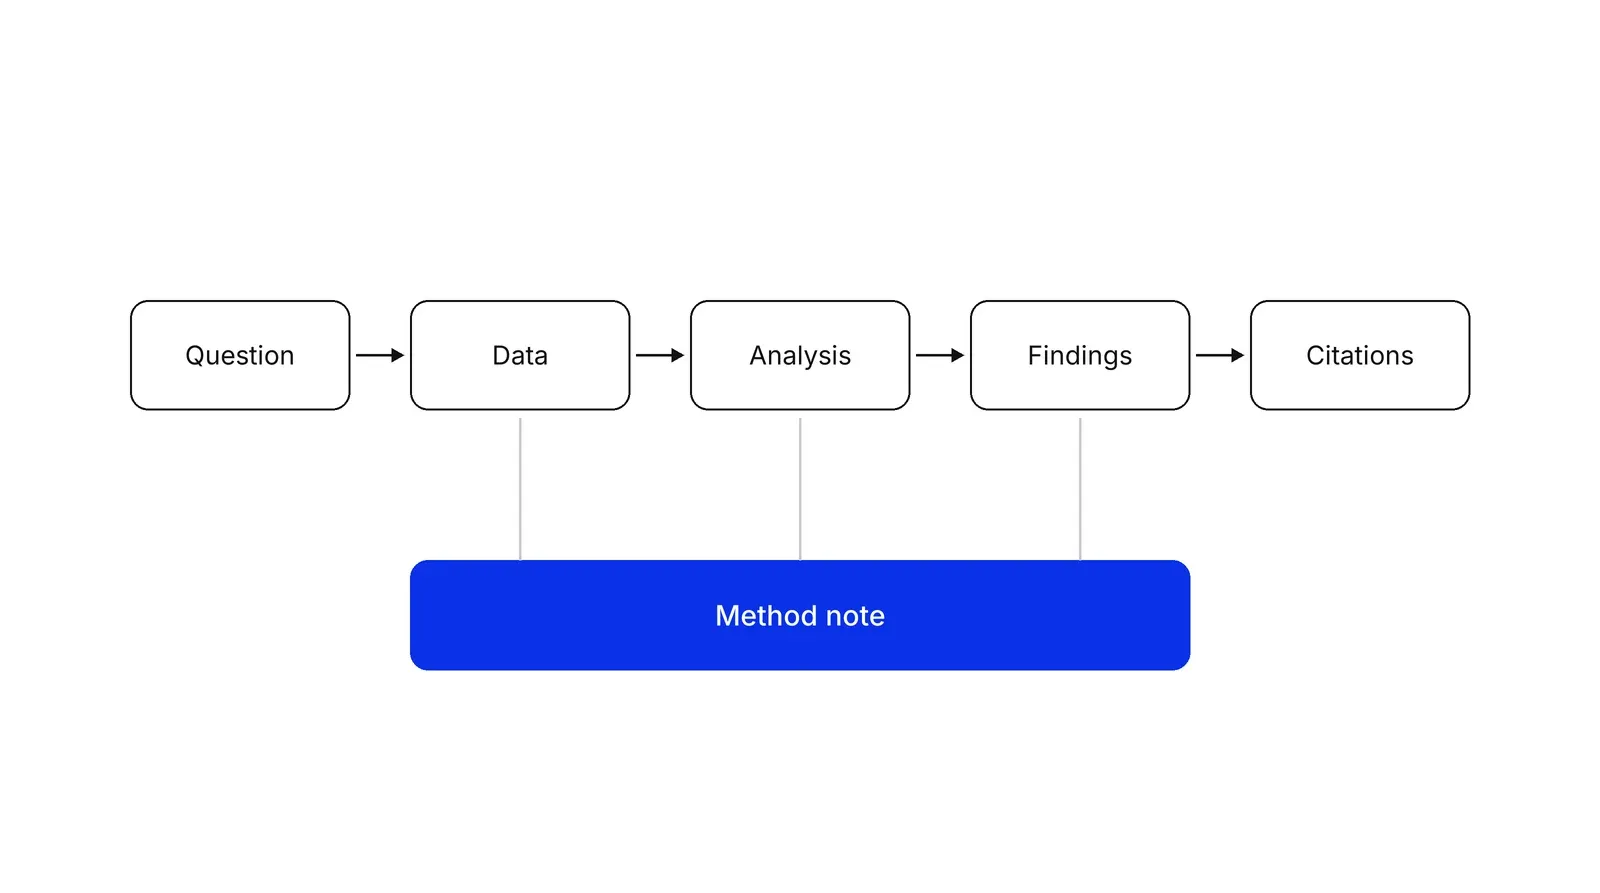
Take SparkToro’s zero-click study as the model. It states that the Datos panel has minimal iOS coverage, that mobile data covers only five months, and that ad blockers may skew the click counts. Compare a large click-through-rate study at Backlinko. It reports 1,312,881 pages and 12,166,560 queries from Search Console accounts supplied by Semrush. Before you quote a study like this, look for how the sites were chosen and what period the data covers. A reader cannot weigh a number without that.
Check who is answering
If you buy a panel, screen it. In a December 2023 opt-in poll, 20% of adults under 30 agreed that the Holocaust is a myth; Pew’s probability-based survey a month later found 3%. In a November 2024 test, Pew’s trap questions flagged 18% of cases among 11,114 adults, and no screening method fully fixed the problem.
Write neutral questions
Pew’s guidance on survey questions says to ask one thing at a time, keep opinion answer lists to about four or five options and ask open-ended questions before related closed ones.
Size the subgroups
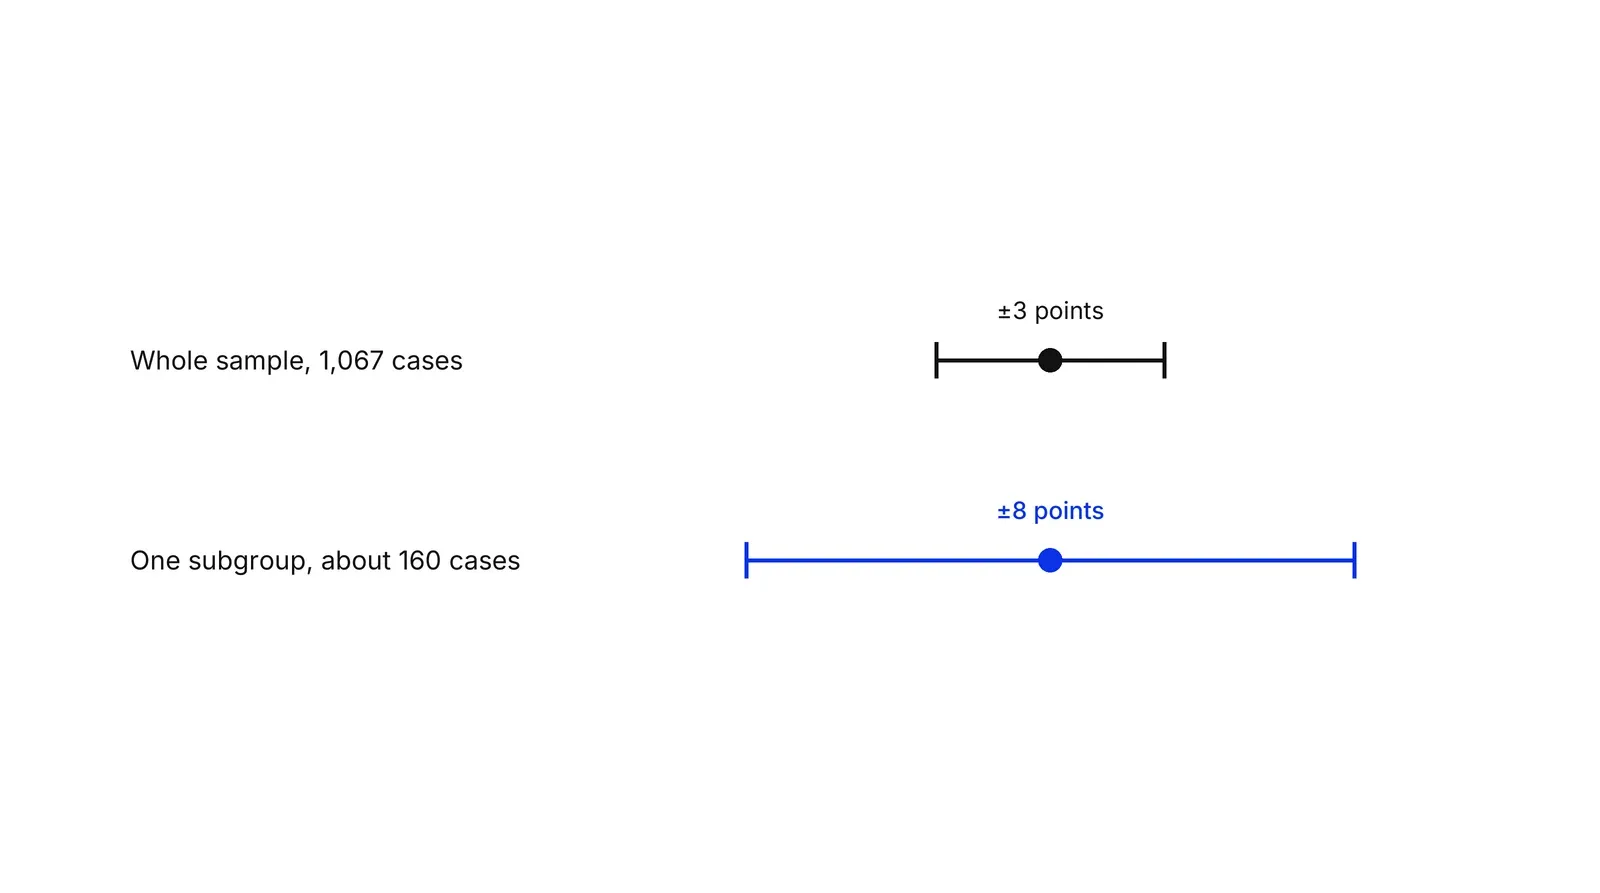
A subgroup has fewer cases, so its margin is wider. In Pew’s example, 1,067 cases give about 3 points and a subgroup of about 160 gives about 8. Pew publishes no estimate when a subgroup has fewer than 100 raw interviews.
Protect the people in the data
If the data comes from your own records, the UK Information Commissioner’s Office says anonymisation must reduce the risk of identifying people to a sufficiently remote level. The ICC/ESOMAR code, revised in 2025, is the usual ethical reference for research.
A Growth Lab plan starts from the question a buyer cannot answer today and works back to the study that answers it.
How to apply Original research as content, step by step
- Pick a question and check the gap. Write the question your buyers argue about, then search for existing answers. Draft the headline you would publish if the answer were surprising. Result: one question, one gap statement and a draft headline.
- Choose the data source. Pick one of the four sources in the table: a survey, your own records, public data analysed in a new way, or a test. Match it to the question and to what you can legally use. Result: a named source and a first list of its biases.
- Plan the sample before collecting. List the subgroups you want to report, such as country or company size, and plan enough cases for the smallest one. Pew Research Center publishes no estimate for a subgroup with fewer than 100 raw interviews. Result: a sampling plan with a minimum count per subgroup.
- Write and pilot the questions. Ask one thing per question, use neutral wording and keep answer lists short, as Pew's guidance advises. Test the draft on about ten people. Result: a final questionnaire or analysis plan.
- Collect, clean and log exclusions. Add trap questions to surveys, remove careless or bogus responses and record every exclusion and why. Result: a clean dataset and a log of what was removed.
- Publish the findings with a method note. Put the headline numbers, charts, sample size, dates, wording and limits on one page, and offer the data. Then take the one-sentence finding to the writers who cover the topic. Result: a citable page and a pitch list.
Examples
SparkToro and Datos on zero-click search (public case)
In 2024 Rand Fishkin of SparkToro and the analytics firm Datos published a study of Google search behaviour built on Datos's clickstream panel. The post gives the headline figures (about 58.5% of US searches ended with no click to the open web) and also lists the weak points: little iPhone and iPad coverage, only five months of mobile data and no control for ad blockers. Because the limits are visible, readers can decide how far to trust each number.
A dental clinic group studying no-shows
Illustrative. A group of clinics compares missed-appointment rates by reminder timing, using its own anonymised bookings. It publishes each rate next to the number of appointments behind it, merges any clinic with too few appointments into a larger group, and has its data protection lead confirm that no patient can be picked out. The result is a finding other clinics can cite without seeing patient data.
A payments startup surveying finance managers
Illustrative. The company surveys 300 finance managers about how long supplier payments take. With 300 answers, a subgroup of 40 firms in one country is too small to report on its own, so the team either widens the sample for that country or drops the cut. It publishes the wording of every question, the field dates and the screening rules.
When to use it
Use it when your market lacks trusted numbers on a question buyers keep asking, when you already hold data nobody else has, or when your content is mostly a rewrite of what others have published. It suits companies that can commit a quarter to a first study and then repeat it, so the numbers build into a series.
When not to use it
Skip it when you cannot reach a sample that fits the claim you want to make, when the data belongs to customers who have not agreed to its use, or when the aim is a quick traffic spike. A thin or one-sided study that gets challenged does more damage than no study. For a single point of view, an opinion article is cheaper.
Common mistakes
- Publishing numbers with no method. Readers and reporters cannot judge a percentage without the sample, dates and question wording. AAPOR's Transparency Initiative lists 12 elements to disclose.
- Reporting subgroups too small to carry the claim. In Pew's example, a subgroup of about 160 cases has a margin of about 8 points, against about 3 for the whole sample.
- Trusting a bought panel without screening. A December 2023 opt-in poll found 20% of adults under 30 agreeing the Holocaust is a myth; Pew's probability-based survey a month later found 3%.
- Writing questions that lead to the headline you wanted. Neutral wording and a pilot protect you from a study that falls apart on challenge.
- Treating publication as the end. A report nobody is told about is a page with a number on it.
FAQ
What counts as original research in content marketing?
Data that did not exist before you produced it: a survey you ran, an analysis of your own records, a new analysis of public data, or an experiment. Collecting other people's statistics into a roundup is curation, not research. Google's guidance for helpful content asks whether a page offers original information, reporting, research or analysis.
How big should the sample be?
It depends on the groups you want to report. Pew's worked example shows a margin of about 3 points for 1,067 cases but about 8 points for a subgroup of roughly 160. Decide your smallest reportable subgroup first and plan enough cases for it. Pew publishes no estimate below 100 raw interviews.
Does original research improve AI search visibility?
Evidence is indirect. A 2024 KDD paper found that adding statistics, quotations and citations to existing text raised visibility in generative engine answers by 30% to 40% on one measure, but it did not test original studies. Google says no special optimization is needed for AI Overviews and AI Mode.
How do you make survey results credible?
Publish who ran it and paid for it, the exact question wording, the field dates, the number of completes, how the sample was recruited and weighted, what you excluded and the limits. AAPOR's Transparency Initiative names 12 such elements. Screen for careless respondents, because opt-in samples contain bogus ones.
How often does original research earn links?
No figure from a primary survey with a stated sample and year was found that supports a general rate, so none is given here. Results depend on topic, sample and outreach. Orbit Media's 2026 survey of 1,042 marketers reports that publishing research raises the chance of strong blog results by 50%, without stating the baseline.
Sources
- Pranjal Aggarwal et al., GEO: Generative Engine Optimization, arXiv 2311.09735, KDD 2024
- Pew Research Center, Online opt-in polls can produce misleading results, especially for young people and Hispanic adults, March 2024
- Pew Research Center, No easy fix for bogus respondents in online opt-in polls, August 2026
- AAPOR, Transparency Initiative disclosure elements
- Orbit Media, 2026 blogging statistics
- Google Search Central, Creating helpful, reliable, people-first content
- Google Search Central, AI features and your website
- Ahrefs, Search traffic study, December 2023
- SparkToro, 2024 zero-click search study, with Datos
- Tony Harcup, Deirdre O'Neill, What is news? News values revisited (again), Journalism Studies 18(12), 2017
- Pew Research Center, Writing survey questions
- ICC and ESOMAR, International Code on Market, Opinion and Social Research and Data Analytics, 2025
- Journalist's Resource, Statistical terms used in research studies: a primer for media, 2015
- Muck Rack, AI citations for PR
- Backlinko, Google organic click-through rate study
- UK Information Commissioner's Office, Anonymisation guidance
- Pew Research Center, Understanding the margin of error in election polls, 2016
- Pew Research Center, Why Pew Research Center will display margins of error in some graphics, 2021
- Ahrefs, AI Overview citations and the top 10, March 2026
- Content Marketing Institute, 2026 B2B content and marketing trends report
Last updated Oct 9, 2026


Marketing agency or growth system: when a company outgrows its agency
An agency is the right call while the founder still runs most of the company. Once the business starts copying itself into new locations or markets, it needs a system that sets goals, tests hypotheses and owns the result.

Why healthcare marketing agencies stall: the short, mid and long wins model we use with clinics
Most agencies own the click and nobody owns the front desk. How we structure clinic work in three horizons, the research behind each one, and one year of results.

Why channel tests stall after month three
Most paid channel tests do not end with a decision. They end when the budget runs out, the attribution model changes, or everyone quietly stops looking at the dashboard.