Creative testing framework
A creative testing framework is a fixed routine for finding ads that sell: test different ideas first, then different versions of the winning idea, in randomized splits, and replace ads before they wear out.
A creative testing framework is a repeatable process for deciding which ads to run. It separates concept tests, which compare different messages or ideas, from execution tests, which compare versions of one idea such as hooks, visuals or copy. Each test runs as a randomized split with one variable, is judged on cost per conversion, and winners are refreshed before audiences tire of them.
- Origin
- No single inventor; performance marketing practice built on copy testing and split-cable research, split-cable copy tests studied from the 1980s; platform A/B tools from the late 2010s
- Level
- 201 · Tool
- Fits
- Startup, Small and mid-size, Scale-up
- Time to apply
- a day to set up the first concept test; two to four weeks per test to read
- What you need
- a conversion event the platform can optimize for, firing reliably (purchase, lead, booking) · budget for about 50 conversions per test arm in the test period · three to five different creative concepts, each built on one distinct message · a test log: hypothesis, variable, dates, spend, result, decision
A creative testing framework is a fixed routine for deciding which ads to run. The team tests different ideas against each other first, then tests versions of the idea that won, using randomized splits with one variable at a time, and it replaces ads before the audience tires of them. Nobody owns the term. It grew out of television copy testing and the split-cable experiments of the 1980s, and today it is everyday practice for anyone buying ads on Meta, TikTok, YouTube or Google.
The routine matters more now because ad platforms have taken over most targeting and bidding. Creative is one of the few levers an advertiser still controls directly.
How much of ad performance comes from creative?
Creative accounts for a large share of advertising’s effect, though the exact share depends on the study. The most quoted number is 47%. It is real but narrower than most people who repeat it suggest.
The figure appears in a chart on Nielsen’s October 2017 article, headed “percent sales contribution by advertising element”. The footnote credits Nielsen Catalina Solutions and nearly 500 campaigns from 2016 to the first quarter of 2017. The article text says these were fast-moving consumer goods campaigns across TV, digital video, mobile, magazines and radio.
| Element | Share of advertising-driven sales lift |
|---|---|
| Creative | 47% |
| Reach | 22% |
| Brand | 15% |
| Targeting | 9% |
| Recency | 5% |
| Context | 2% |
Three cautions apply. The 47% is a share of the sales lift that advertising produced, not of total sales. The sample is packaged goods brands, not app installs or lead generation. And the same Nielsen article says an earlier study, Project Apollo in 2006, put creative’s share at 65%, while media’s share rose from 15% to 36% over 11 years. Google cites a different kind of number: ads that follow its ABCD principles show a “30% lift in short-term sales likelihood”, per Think with Google. Kantar’s case study shows that this is a model prediction from scoring over 11,000 ads, not measured sales. The fair summary: creative is usually the largest single factor, and no one number transfers to your account.
Concept tests and execution tests
A concept test compares different messages. An execution test compares versions of one message. The split matters because the two answer different questions and need different budgets.
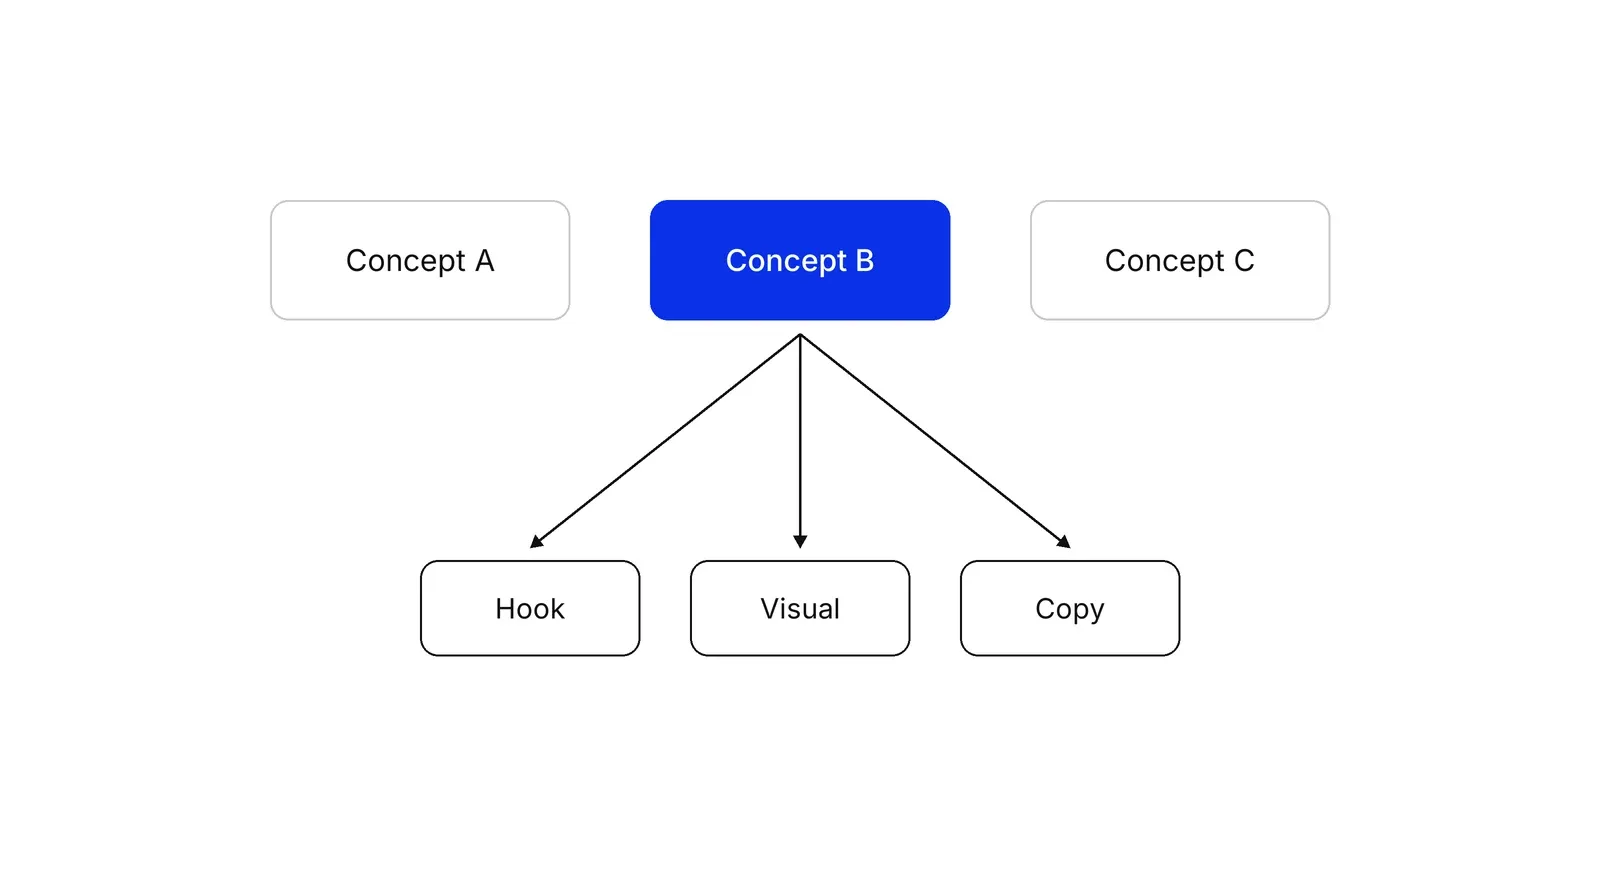
| Concept test | Execution test | |
|---|---|---|
| Question | What should we say? | How should we show it? |
| What varies | The core message or angle | Hook, visual, headline, format |
| Typical size of difference | Large | Smaller |
| When | First, and whenever results stall | After a concept wins |
Google draws the same line from the other side. Its ABCD guidance says the principles are “not a formula for generating creative ideas”, only for executing an idea already chosen. Leonard Lodish and colleagues analysed 389 split-cable TV tests and found that changing brand, copy and media strategy raised the chance of a sales effect in some categories, while standard recall and persuasion scores did not track sales well. Judge creative on sales or conversions, not on how much people liked it.
Why comparing ads in one ad set is not a test
Platforms do not show your ads to random people. Meta’s help page on ad delivery says that with several ads in an ad set, it shows each person the ad most likely to get the lowest cost per result, so ads are not delivered equally. The ad that wins inside an ad set may simply have been shown to easier buyers.
Dean Eckles, Brett Gordon and Garrett Johnson made this point in PNAS in 2018: comparing ad campaigns on a standard platform does not randomly assign users, and optimization makes the exposed groups differ. Michael Braun and Eric Schwartz went further in the Journal of Marketing, calling it divergent delivery and showing it can distort the size and even the sign of a test result.
The practical fix is the platform’s own split tool. Meta’s A/B test makes sure “nobody sees both” versions. Google Ads custom experiments recommend a 50% cookie-based split so each user sees one version, and Demand Gen asset tests let you pick 70%, 80% or 95% confidence. TikTok’s split test splits the audience into two equal groups and names a winner at 90% confidence. Braun and Schwartz note a limit even here: each arm is still optimized, so the result tells you which ad wins with that platform’s targeting, not why.
How big a test needs to be
Ad tests are noisy, so most accounts need more conversions than they expect. Randall Lewis and Justin Rao studied 25 large field experiments and found the median confidence interval on return on investment was over 100 percentage points wide. Comparing two creatives is easier than measuring total return, but the same noise applies.
Platform rules give a working floor. Meta recommends at least seven days per test and caps tests at 30. Its learning phase usually ends after about 50 results in a week, and Google’s Demand Gen tests need 50 conversions per arm before showing results. Take an account paying $40 per lead: two arms at 50 leads each cost about $4,000. If that is more than a month’s budget, test fewer, bolder concepts rather than many small tweaks.
Creative fatigue: when to refresh
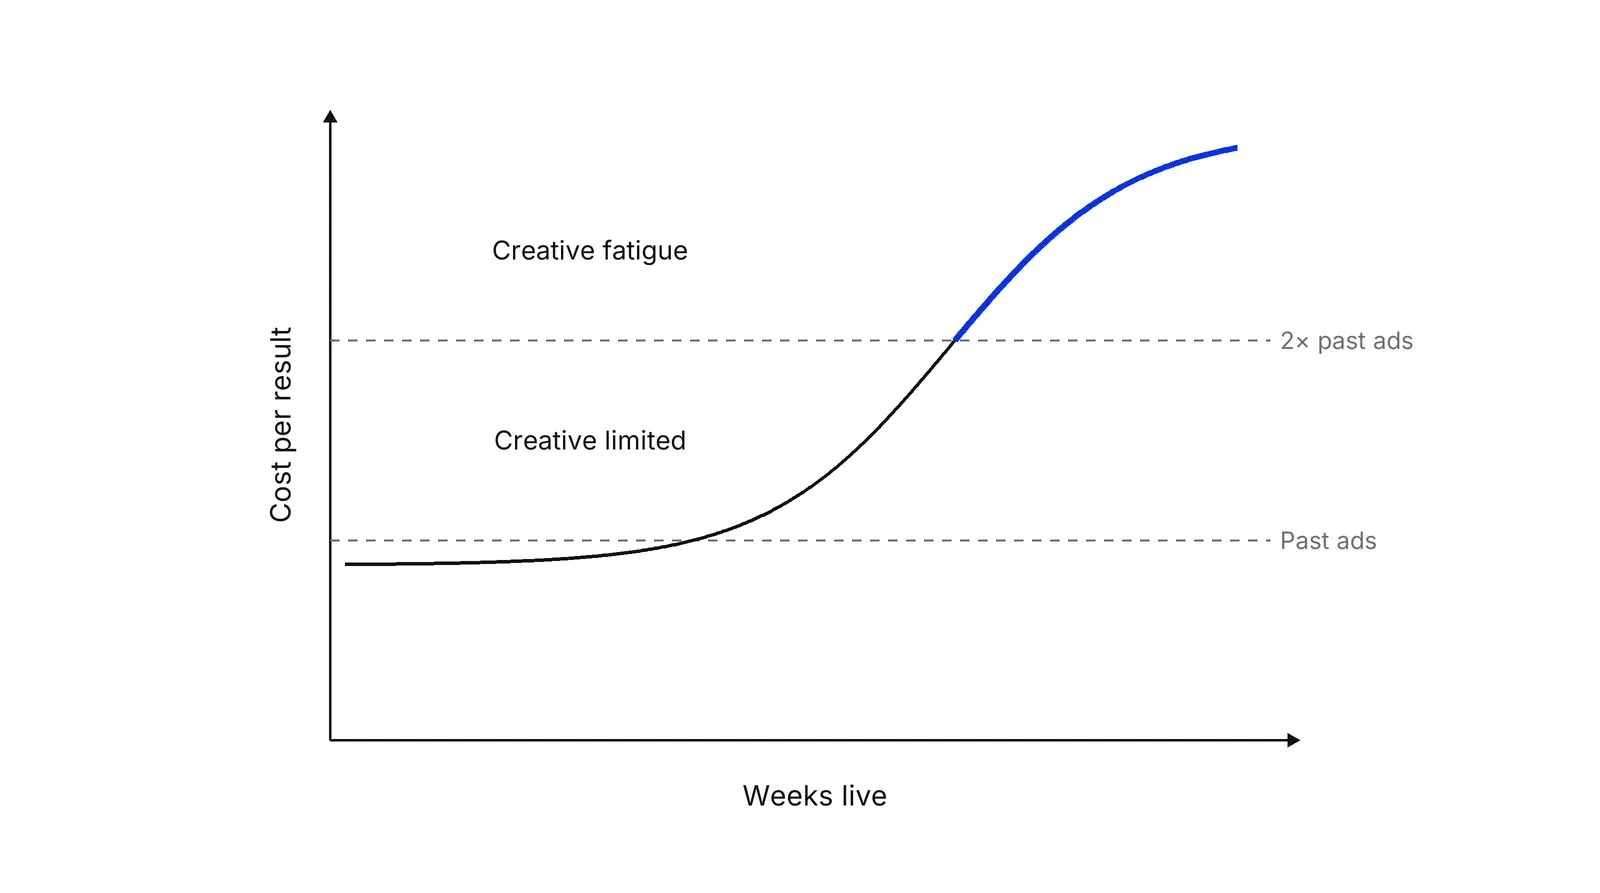
Creative fatigue is the drop in results when the same people see the same ad too often. Bobby Calder and Brian Sternthal documented commercial wearout in 1980: repetition lowered viewers’ opinions of both the ads and the products. Margaret Blair’s study of about 100 ARS cases found no real evidence of wear-in, but wearout does occur.
Meta now puts numbers on it. Its creative fatigue page says an ad gets the Creative limited status when cost per result is above your past ads but under twice as much, and Creative fatigue at twice as much or more. Meta counts recent exposures from all your Page’s campaigns and recommends a new ad that is “materially different”, while keeping the old one running.
What automation changes
Automated tools now make many execution tests for you. Meta’s Advantage+ creative adjusts images, text and video per viewer, and Meta’s engineering team built its Andromeda retrieval system expecting the number of ads to grow sharply with generative AI. Meta also reports a 22% rise in return on ad spend for advertisers who turned on Advantage+ creative, a company figure, not an independent test.
The human job shifts toward concepts. Machines can vary a headline; they cannot decide whether to sell on price or on trust. Keep feeding distinct messages, and treat each test as part of a wider experimentation program, sized with minimum detectable effect maths. In Pushers’ Growth Lab work, concept tests sit in the same weekly test log as channel and offer tests.
How to apply Creative testing framework, step by step
- Write the hypotheses as messages. List the reasons a customer might buy, one per line: price, speed, safety, status, a specific pain. Turn each into a concept with one headline idea. Result: three to five concepts that differ in what they say, not in colour or layout.
- Run a concept test in a randomized split. Use the platform's A/B or experiment tool so each person sees only one arm: Meta A/B test, a Google Ads experiment with a cookie-based split, Demand Gen asset A/B tests or TikTok split testing. Keep audience, budget and placements equal. Result: a concept test with one variable and a fixed end date of at least seven days.
- Judge on cost per conversion, not clicks. Read cost per result or cost per conversion lift, with the confidence the tool reports. Ignore click-through rate as the deciding metric. Result: one winning concept, or a written note that no concept beat the others and the test needs a bigger budget or bolder concepts.
- Test executions of the winner. Keep the winning message and vary one element at a time: the first three seconds of a video, the visual, the headline, the format. Result: two or three strong versions of one idea, ready to scale.
- Scale and watch for fatigue. Move winners into the main campaign and track cost per result against your past ads. In Meta, watch for the Creative limited and Creative fatigue statuses. Result: a refresh date for every live ad, set before performance collapses.
- Feed the pipeline every month. Add new concepts on a fixed schedule, and log every result, including losses. Result: a library of tested messages that tells the team what this audience responds to.
Examples
Bing and one ad headline
Ron Kohavi and Stefan Thomke describe a 2012 idea at Microsoft to change how Bing displayed ad headlines. Managers rated it low priority and it sat for more than six months. When an engineer finally ran an A/B test, revenue rose 12%, worth more than $100 million a year in the US, according to their 2017 Harvard Business Review article. The lesson for creative teams: opinions about which version will win are often wrong, and a cheap test settles it.
A retail bank and bandit allocation
Eric Schwartz, Eric Bradlow and Peter Fader ran a two-month display campaign for a large retail bank, delivering over 750 million impressions. Their adaptive policy shifted impressions toward better-performing ad versions during the test and lifted the customer acquisition rate by 8% over a control policy, according to their 2017 paper in Marketing Science. They also estimated acquisition would have fallen about 10% if the bank had optimized for clicks instead of sign-ups.
A dental clinic testing two concepts
Illustrative, no real clinic implied. A clinic spends $3,000 a month on Meta ads at about $40 per booked consultation, so roughly 75 bookings. It tests two concepts in a Meta A/B test: price transparency (a fixed price for implants) against reassurance (a surgeon explaining the procedure). Splitting the month's budget gives each arm about 37 bookings, below the 50 results Meta's learning phase usually needs. Meta caps A/B tests at 30 days, so the clinic either raises the test budget to $4,000 for the month or treats the result as directional. Gen AI creative tools may not be available to health advertisers, so both concepts are shot by hand.
When to use it
Use it when paid social or video is a major acquisition channel, when cost per acquisition is rising and nobody knows whether the cause is the ads, the audience or the offer, or when a team produces creative by taste and wants evidence. It fits any account that can buy roughly 50 conversions per arm within a month.
When not to use it
Skip formal tests when volume is too low for any split to reach a result in 30 days; pick bold concepts, run them one after another and judge on business numbers instead. Do not use it to answer whether advertising works at all. That needs a holdout or lift study, not a comparison of two ads.
Common mistakes
- Comparing ads inside one ad set and calling it a test. Meta's delivery system gives more impressions to the ad it predicts will win, so the comparison is not randomized.
- Testing button colours and fonts while every ad says the same thing. Execution tweaks rarely rescue a weak message; test concepts first.
- Choosing winners on click-through rate. Cheap clicks and buyers are different people, and the bank study above estimated a 10% loss in acquisition from optimizing clicks.
- Stopping a test after two or three days because one arm is ahead. Meta recommends at least seven days and longer when customers take more than a week to convert.
- Quoting one statistic, such as creative drives 47% of sales, as a law. That figure comes from consumer packaged goods campaigns measured on sales lift, not from your account.
FAQ
What is A/B testing of ad creatives?
It is a test where an ad platform splits an audience at random into groups, shows each group one version of an ad and compares cost per result. Meta, Google Ads and TikTok all offer tools that keep the same person from seeing both versions. Change only one thing between versions, or you will not know what caused the difference.
How long should a creative test run?
At least seven days on Meta, which caps A/B tests at 30 days and suggests running longer when customers take more than a week to convert. Plan budget for about 50 conversions per arm: Meta's learning phase usually ends after about 50 results, and Google's Demand Gen experiments need 50 conversions per arm to show results.
What is the difference between a concept test and an execution test?
A concept test compares different ideas or messages, for example price against speed. An execution test compares versions of one idea, for example two openings of the same video. Concept tests usually move results more, so run them first, then refine the winner with execution tests.
Does creative really drive most ad performance?
In one large study, yes. Nielsen's 2017 chart, based on nearly 500 consumer packaged goods campaigns measured by Nielsen Catalina Solutions, gave creative 47% of advertising-driven sales lift, ahead of reach at 22%. Different samples give different shares, so treat it as evidence that creative matters a lot, not as a fixed number.
How do you know when an ad creative is fatigued?
Meta flags it in the Delivery column. Creative limited means cost per result is above your past ads but under twice as much; Creative fatigue means twice as much or more. On other platforms, track frequency and cost per conversion by week; a steady rise with stable targeting usually means the audience is tired of the ad.
Sources
- Nielsen, When it comes to advertising effectiveness, what is key?, October 2017
- Meta Business Help Centre, About A/B testing
- Meta Business Help Centre, Best practices for A/B testing
- Meta Business Help Centre, About Advantage+ creative
- Meta Business Help Centre, About creative fatigue recommendations in Meta Ads Manager
- Meta Business Help Centre, About ad delivery
- Meta Business Help Centre, About the learning phase
- Engineering at Meta, Meta Andromeda: Supercharging Advantage+ automation with the next-gen personalized ads retrieval engine, December 2024
- Google Ads Help, Set up a custom experiment
- Google Ads Help, About ad variations
- Google Ads Help, Create A/B experiments for Demand Gen campaigns
- Think with Google, The ABCDs of effective video ads, April 2022
- Kantar, Validating Google's ABCD framework with the power of artificial intelligence
- TikTok Ads Help Center, About split testing
- Michael Braun, Eric M. Schwartz, Where A/B Testing Goes Wrong: How Divergent Delivery Affects What Online Experiments Cannot (and Can) Tell You About How Customers Respond to Advertising, Journal of Marketing 89(2), 2025
- Dean Eckles, Brett R. Gordon, Garrett A. Johnson, Field studies of psychologically targeted ads face threats to internal validity, PNAS 115(23), 2018
- Leonard M. Lodish et al., How T.V. Advertising Works: A Meta-Analysis of 389 Real World Split Cable T.V. Advertising Experiments, Journal of Marketing Research 32(2), 1995
- Bobby J. Calder, Brian Sternthal, Television Commercial Wearout: An Information Processing View, Journal of Marketing Research 17(2), 1980
- Margaret Henderson Blair, An Empirical Investigation of Advertising Wearin and Wearout, Journal of Advertising Research (1987; classic reprint 2000)
- Cornelia Pechmann, David W. Stewart, Advertising Repetition: A Critical Review of Wearin and Wearout, Current Issues and Research in Advertising 11, 1988
- Randall A. Lewis, Justin M. Rao, The Unfavorable Economics of Measuring the Returns to Advertising, Quarterly Journal of Economics 130(4), 2015
- Brett R. Gordon, Florian Zettelmeyer, Neha Bhargava, Dan Chapsky, A Comparison of Approaches to Advertising Measurement: Evidence from Big Field Experiments at Facebook, Marketing Science 38(2), 2019
- Brett R. Gordon et al., A Comparison of Approaches to Advertising Measurement, Kellogg white paper, 2016
- Eric M. Schwartz, Eric T. Bradlow, Peter S. Fader, Customer Acquisition via Display Advertising Using Multi-Armed Bandit Experiments, Marketing Science 36(4), 2017
- Ron Kohavi, Stefan Thomke, The Surprising Power of Online Experiments, Harvard Business Review, September-October 2017
Last updated Oct 9, 2026


Marketing agency or growth system: when a company outgrows its agency
An agency is the right call while the founder still runs most of the company. Once the business starts copying itself into new locations or markets, it needs a system that sets goals, tests hypotheses and owns the result.

Why healthcare marketing agencies stall: the short, mid and long wins model we use with clinics
Most agencies own the click and nobody owns the front desk. How we structure clinic work in three horizons, the research behind each one, and one year of results.

Why channel tests stall after month three
Most paid channel tests do not end with a decision. They end when the budget runs out, the attribution model changes, or everyone quietly stops looking at the dashboard.