Voice of the customer (VoC)
Voice of the customer is a method for collecting customer needs in the customer's own words, sorting them into a hierarchy, ranking them by importance and turning the top ones into product, service and process decisions.
Voice of the customer (VoC) is a research method that collects customer needs in the customer's own words, structures them into primary, secondary and tertiary needs, and ranks them by importance so a team can decide what to build or fix. It began as the first step of quality function deployment and was formalized by Abbie Griffin and John Hauser in a 1993 Marketing Science paper.
- Origin
- Quality function deployment practice in Japan; formalized for marketing by Abbie Griffin and John R. Hauser, QFD from 1966 or 1972 (sources differ); VoC paper 1993
- Level
- 201 · Tool
- Fits
- Small and mid-size, Scale-up, Enterprise
- Time to apply
- 3 to 6 weeks for a first round of interviews, structuring and an importance survey; ongoing for a feedback program
- What you need
- one decision the research has to inform: a new product, a redesign, a service fix · access to 20 to 30 customers for one-hour interviews · two or more people from different functions to read the transcripts · a survey tool to rank the structured needs with a larger sample
Voice of the customer (VoC) is a research method that captures customer needs in the customer’s own words, sorts them into a hierarchy and ranks them by importance, so a team can decide what to build, fix or measure. The term comes from quality management. Abbie Griffin and John Hauser gave it its research form in a 1993 Marketing Science paper that tested how many interviews you need, who should read them and how to rank what you find. Today the same name also covers ongoing feedback programs that pull in surveys, support tickets and reviews.
Where voice of the customer came from
VoC started as the first room of quality function deployment (QFD), a Japanese product development method that carries customer needs through design, engineering and manufacturing. The dates differ by source. Hauser and Don Clausing, in their 1988 Harvard Business Review article, place its origin at Mitsubishi’s Kobe shipyard in 1972, later developed by Toyota and its suppliers. Yoji Akao and Glenn Mazur, writing in the International Journal of Quality & Reliability Management in 2003, say leading companies have practiced QFD since 1966.
By Griffin and Hauser’s account in their 1991 working paper, QFD reached the US in 1986 through Ford and Xerox. Their contribution was to test the customer-input stage with data: how many interviews, how many readers, which ranking method.
The three tasks: identify, structure, prioritize
Griffin and Hauser split VoC into three tasks. Each came with data that still shapes how good teams run it.
Identify needs with one-on-one interviews
A need is a benefit the customer wants, stated in their words: “the text is easy to read”, not “a 17-inch screen”. Typical studies interviewed 10 to 30 customers for about an hour each. In one comparison, a single interview found 33% of 230 needs, two interviews found 51%, and one two-hour focus group found 50%. The authors concluded one-on-one interviews may be the more cost-effective choice.
How many is enough? In their data, 20 interviews found over 90% of the needs that 30 interviews found, and the authors proposed 20 to 30 interviews for 90 to 95% coverage. A later qualitative study by Hennink, Kaiser and Marconi found 91% of themes by the ninth interview, but needed 16 to 24 to understand the more abstract ones. Narrow questions saturate faster.
Who reads matters too. Each analyst in the study caught only 45% to 68% of the needs in the same transcripts. Two or three readers from different functions catch more.
Structure needs into a hierarchy
Interviews usually yield 200 to 400 needs, too many for anyone to use. VoC groups them into three levels. Primary needs set strategic direction. Each primary splits into 3 to 10 secondary needs, which tell the team what to do. Tertiary needs give engineers and operators the detail. Most companies build the tree with a team affinity chart. Griffin and Hauser found that a tree built from customers sorting the cards themselves read more clearly and reflected how customers, not engineers, see the category.
Prioritize with measured importance
Rank needs with a survey, not with a tally of mentions. Their study found that frequency of mention “does not appear to be a good surrogate for importance.” It also warned about satisfaction scores taken only from a brand’s own buyers: a niche brand can score higher than the category leader simply because its few customers chose it for a narrow reason.
From needs to design: the house of quality
The house of quality is the matrix where customer needs meet the measurable attributes a team controls. Needs and their importance form the left wall. Design or process attributes run across the top. The body records how strongly each attribute affects each need, and the roof shows where attributes trade off against each other.
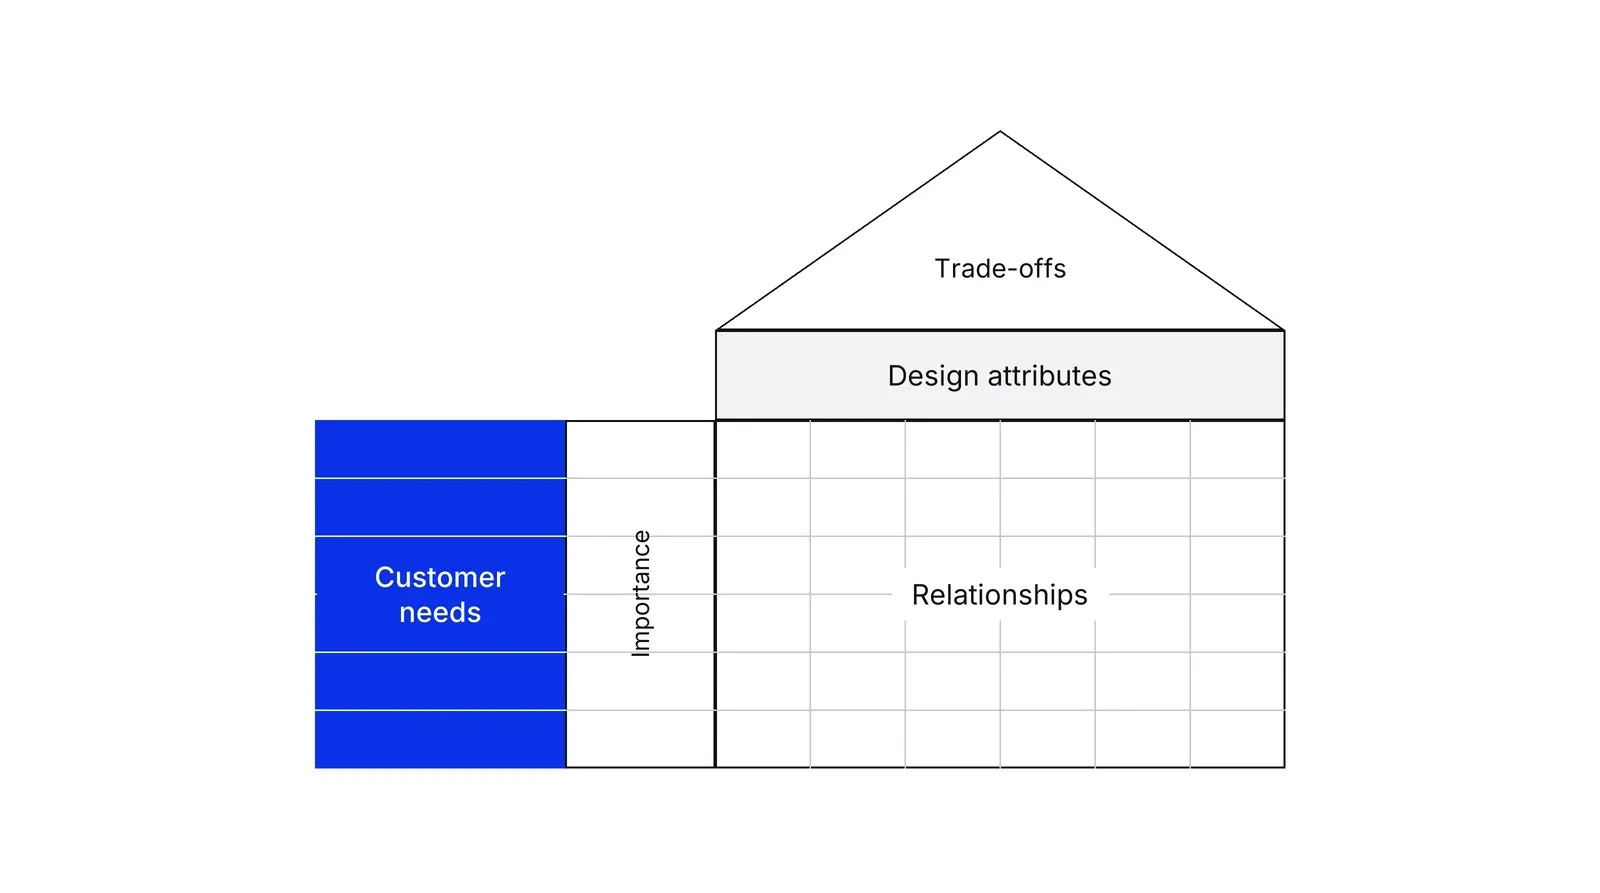
Hauser’s 1993 case on Puritan-Bennett shows the translation. The team found 26 customer needs and defined 56 design attributes. “Printout quality” became printer resolution, fade resistance and paper-feed failure rate. Each of those can be measured, targeted and owned, which is what “translating VoC into process metrics” means in practice. Griffin and Hauser’s 1992 Management Science study of two matched teams adds a side effect: the QFD team talked more directly across marketing, engineering and manufacturing.
Modern VoC programs: from study to system
A modern VoC program runs the same logic continuously. It draws on three kinds of input. Direct feedback comes from interviews and short surveys such as CSAT and CES. Indirect feedback comes from support tickets, call notes and reviews. Observed behavior comes from watching customers at the gemba, the Lean term for the place where the work happens.
Indirect sources now scale. Artem Timoshenko and Hauser coded 12,000 sentences of online reviews about oral care products and found such content at least as valuable as interviews for finding needs, with machine learning filtering out repetitive and uninformative text.
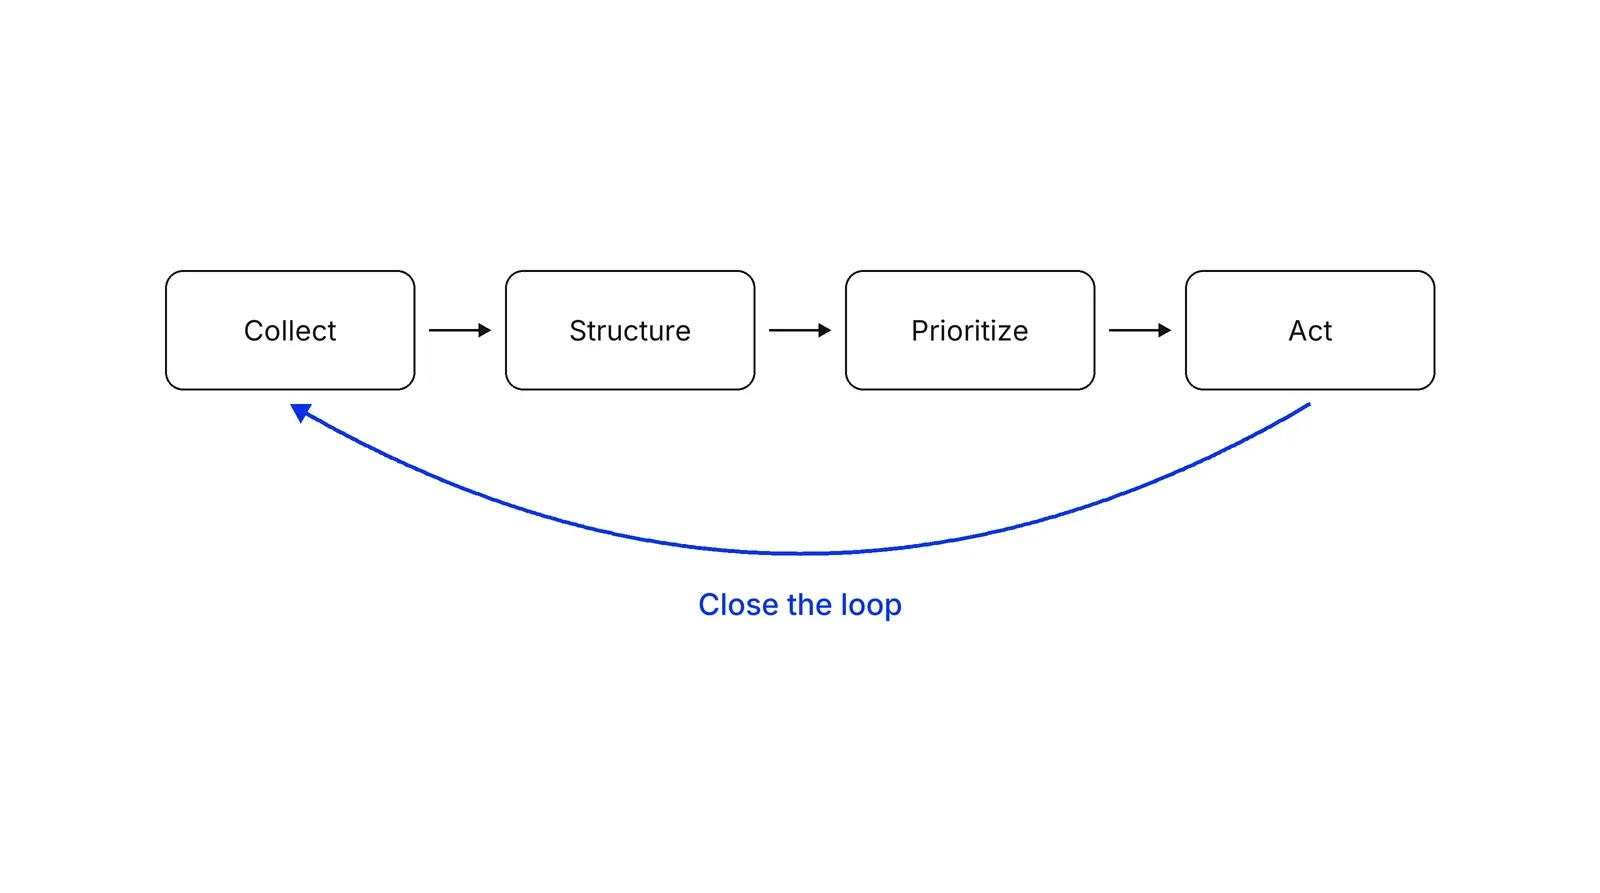
The last step is closing the loop. Rob Markey, Fred Reichheld and Andreas Dullweber argued in HBR in 2009 that the payoff comes from simple feedback routed fast to frontline staff with authority to act. The gap is wide: in a 2005 Bain survey of 362 firms, 80% believed they delivered a superior experience, while customers said only 8% did. Read feedback across the whole journey, not one touchpoint at a time; a customer journey map gives the program that frame.
Where VoC falls short, and what to pair it with
Customers describe today’s problems well and tomorrow’s solutions badly. Anthony Ulwick wrote in HBR in 2002 that customers tend to propose solutions, and products built to those requests often flop. Dorothy Leonard and Jeffrey Rayport made a similar point in 1997: customers are bounded by their experience, so watching them use a product finds needs they never voice. Eric von Hippel’s lead users, customers whose needs today will be common in a few years, fill a similar gap.
| Method | Question it answers | Output |
|---|---|---|
| Voice of the customer | What do customers need, and which needs matter most? | Ranked need hierarchy |
| CSAT and CES | How did this one interaction go? | Scores per touchpoint |
| Jobs to be done | What progress is the customer trying to make? | Job statements and switching triggers |
| Kano model | Which needs delight and which are only expected? | Need categories |
Kano’s 1984 paper split quality into must-be, one-dimensional and attractive elements, a useful lens for the ranked list. In our Growth Lab work, a top-ranked need with a large gap becomes the next hypothesis to test.
How to apply Voice of the customer (VoC), step by step
- Name the decision and the customer. Write down what the research will change: a product spec, a service process, a pricing page. Then define whose voice counts: current buyers, lost buyers, users who are not buyers. Result: a one-line brief and a recruiting list.
- Interview 20 to 30 customers one at a time. Run one-hour interviews about real experiences: the last time they did the task, what went wrong, what they wished for. Probe until no new needs come out. Griffin and Hauser found that two such interviews surface about as many needs as one two-hour focus group. Result: transcripts in the customer's words.
- Extract needs with several readers. Have at least two people from different functions read every transcript and write each need as a short statement of benefit, not a feature. Merge the lists and remove duplicates. Result: a raw list, usually in the hundreds.
- Structure the needs into a hierarchy. Group the raw needs into tertiary needs, then secondary, then a handful of primary needs. If you can, ask a sample of customers to sort the cards themselves instead of relying only on the team's affinity chart. Result: a tree that reads in customer language.
- Rank importance with a survey. Ask a larger sample to rate how important each secondary need is and how well you and the best competitor meet it. Do not use how often a need was mentioned as a stand-in for importance. Result: a ranked list with performance gaps.
- Translate the top needs into measures and owners. For each high-importance, high-gap need, define one or more measurable design or process attributes, set a target and name an owner. Then tell customers what changed. Result: a short plan that links each need to a metric and a date.
Examples
A medical device maker fighting a cheaper rival
Documented case (Hauser, MIT Sloan Management Review, 1993). Puritan-Bennett's spirometer share fell from 15% to 7% between 1988 and 1990 after Welch Allyn launched a $1,995 product. A cross-functional team ran focus groups and interviews, identified 26 customer needs and translated them into 56 design attributes; 'printout quality' became printer resolution, fade resistance and paper-feed failure rate. The resulting modular system offered a basic version at $1,590.
A dental clinic's booking experience
Illustrative. A clinic interviews 24 patients about their last booking. Readers extract 180 needs, grouped under five primary needs such as 'getting an appointment is quick' and 'I know what it will cost'. An importance survey of 300 patients ranks 'I know the price before I arrive' first, with the clinic rated far below a competitor. The team publishes price ranges per treatment and tracks one measure: the share of first visits where the final bill matched the estimate.
A payments startup's onboarding
Illustrative. A B2B payments company reads 2,000 support tickets and app reviews, then interviews 20 merchants who abandoned onboarding. The top secondary need is 'I know what documents I still owe'. The team turns it into a process measure, days from application to approval, and a design change, a checklist that shows outstanding documents.
When to use it
Use VoC before a new product or a major redesign, when a team argues about what customers want, or when you need to turn vague complaints into measurable targets. It also fits as the research layer of an ongoing feedback program that routes survey, ticket and review data to the people who can act.
When not to use it
Skip a full VoC study when the question is narrow and measurable, such as which of two checkout buttons converts better; an experiment answers that faster. Do not rely on it alone for radically new products, where customers cannot describe needs they have not met yet; add observation and lead-user research. And do not start one if nobody has the authority to act on the results.
Common mistakes
- Recording feature requests as needs. 'Add a dashboard' is a solution; the need behind it might be 'I know where my order is without calling'.
- Using focus groups by default. Griffin and Hauser's data showed one-on-one interviews found needs at least as efficiently, without one loud voice steering the room.
- Ranking needs by how often people mentioned them. The same study found frequency of mention a poor proxy for importance.
- Measuring satisfaction only among your own buyers. Monadic scores carry a self-selection bias: a niche brand can outscore the category leader.
- Collecting feedback and never closing the loop. Feedback that changes nothing customers can see teaches them to stop giving it.
FAQ
What is a voice of the customer program?
A VoC program is the ongoing system that collects what customers say, through interviews, surveys, support tickets and reviews, structures it into needs, ranks them and routes them to the people who can act. The research study is the first round; the program repeats it and adds a loop that tells customers and staff what changed.
How many customer interviews do you need for voice of the customer?
Griffin and Hauser's data suggested 20 to 30 one-on-one interviews identify 90 to 95% of customer needs in a category; in their study, 20 interviews found over 90% of the needs that 30 found. Narrower questions saturate sooner: a 2017 study found 91% of codes by the ninth interview.
How do you translate voice of the customer into process metrics?
Take each important need from the hierarchy and ask what measurable attribute would show it is met. 'Printout is readable' became printer resolution, fade resistance and paper-feed failure rate at Puritan-Bennett. Set a target for each attribute and an owner, and record the link in a matrix such as the house of quality.
What is the difference between VoC and NPS?
VoC is a method for finding and ranking specific needs; Net Promoter Score is a single loyalty question. NPS tells you how likely customers are to recommend you, not what to change. Research is mixed on NPS: Morgan and Rego (2006) found recommendation metrics had little predictive value compared with average satisfaction.
What are the stages of collecting the voice of the customer?
Griffin and Hauser describe three: identify needs through interviews, structure them into primary, secondary and tertiary levels, and set priorities with importance ratings. Modern programs add two more: translate priorities into measures with owners, and close the loop by telling customers and frontline staff what changed.
Sources
- Abbie Griffin, John R. Hauser, The Voice of the Customer, Marketing Science 12(1), 1993
- Abbie Griffin, John R. Hauser, The Voice of the Customer, MIT Sloan working paper 3449-92, 1991 (DSpace@MIT)
- John R. Hauser, Don Clausing, The House of Quality, Harvard Business Review, May-June 1988
- John R. Hauser, How Puritan-Bennett Used the House of Quality, MIT Sloan Management Review, Spring 1993
- Yoji Akao, Glenn H. Mazur, The leading edge in QFD: past, present and future, International Journal of Quality & Reliability Management 20(1), 2003
- Abbie Griffin, John R. Hauser, Patterns of Communication Among Marketing, Engineering and Manufacturing, Management Science 38(3), 1992
- Noriaki Kano, Nobuhiko Seraku, Fumio Takahashi, Shin-ichi Tsuji, Attractive Quality and Must-Be Quality, Journal of the Japanese Society for Quality Control 14(2), 1984
- Artem Timoshenko, John R. Hauser, Identifying Customer Needs from User-Generated Content, Marketing Science 38(1), 2019 (DSpace@MIT)
- Rob Markey, Fred Reichheld, Andreas Dullweber, Closing the Customer Feedback Loop, Harvard Business Review, December 2009 (Bain & Company)
- James Allen, Frederick F. Reichheld, Barney Hamilton, Rob Markey, Closing the delivery gap, Bain & Company, 2005
- Alex Rawson, Ewan Duncan, Conor Jones, The Truth About Customer Experience, Harvard Business Review, September 2013
- Lean Enterprise Institute, Gemba (Lean Lexicon)
- Matthew Dixon, Karen Freeman, Nick Toman, Stop Trying to Delight Your Customers, Harvard Business Review, July-August 2010
- Frederick F. Reichheld, The One Number You Need to Grow, Harvard Business Review, December 2003
- Neil A. Morgan, Lopo L. Rego, The Value of Different Customer Satisfaction and Loyalty Metrics in Predicting Business Performance, Marketing Science 25(5), 2006
- Monique M. Hennink, Bonnie N. Kaiser, Vincent C. Marconi, Code Saturation Versus Meaning Saturation: How Many Interviews Are Enough?, Qualitative Health Research 27(4), 2017
- Anthony W. Ulwick, Turn Customer Input into Innovation, Harvard Business Review, January 2002
- Dorothy Leonard, Jeffrey F. Rayport, Spark Innovation Through Empathic Design, Harvard Business Review, November-December 1997
- Eric von Hippel, Lead Users: A Source of Novel Product Concepts, Management Science 32(7), 1986 (MIT collected papers)
- Clayton M. Christensen, Taddy Hall, Karen Dillon, David S. Duncan, Know Your Customers' Jobs to Be Done, Harvard Business Review, September 2016
Last updated Oct 9, 2026


Marketing agency or growth system: when a company outgrows its agency
An agency is the right call while the founder still runs most of the company. Once the business starts copying itself into new locations or markets, it needs a system that sets goals, tests hypotheses and owns the result.

Why healthcare marketing agencies stall: the short, mid and long wins model we use with clinics
Most agencies own the click and nobody owns the front desk. How we structure clinic work in three horizons, the research behind each one, and one year of results.

Why channel tests stall after month three
Most paid channel tests do not end with a decision. They end when the budget runs out, the attribution model changes, or everyone quietly stops looking at the dashboard.