Net Promoter Score (NPS)
Net Promoter Score is a loyalty metric built from one 0-to-10 question about recommending a company, reported as the share of promoters minus the share of detractors, and best used as a signal to investigate rather than as a verdict.
Net Promoter Score (NPS) is a customer loyalty metric from one question, 'How likely are you to recommend us to a friend or colleague?', answered from 0 to 10. Answers of 9 or 10 are promoters, 0 to 6 are detractors, and NPS is the percentage of promoters minus detractors, from -100 to +100. Research shows it is a useful signal, not the only number a company needs.
- Origin
- Fred Reichheld, Bain & Company, 2003
- Level
- 201 · Tool
- Fits
- Startup, Small and mid-size, Scale-up, Enterprise
- Time to apply
- a day to set up the question; one to two quarters of responses before the trend means anything
- What you need
- a list of customers you can reach, with enough responses to report a margin of error · a way to ask one open follow-up question next to the score · someone who will contact detractors and own what the answers reveal
Net Promoter Score, or NPS, is a customer loyalty metric built from one survey question: how likely is it that you would recommend us to a friend or colleague? Customers answer from 0 to 10, and the score is the percentage who answer 9 or 10 minus the percentage who answer 0 to 6. Companies use it to track the health of the customer relationship over time and to find unhappy customers early.
Where NPS came from
Fred Reichheld, then a Bain & Company partner, introduced the metric in a December 2003 Harvard Business Review article, “The One Number You Need to Grow”. His argument was that long satisfaction surveys were complicated and did not predict growth, and that the recommend question did better. According to a later review by Douglas Grisaffe, Reichheld drew on more than a dozen industries and said the question was not the best predictor in a few, such as cable TV and local phone service, which he put down to customers having no choice.
Bain describes three stages since then, which it calls the movement, the system and the golden rule; the second came with the 2011 book The Ultimate Question 2.0, co-written with Rob Markey. The Net Promoter System site says the trademarks belong to Bain, NICE Systems and Reichheld.
How the score is calculated
NPS is arithmetic on three groups. Promoters answered 9 or 10, passives answered 7 or 8, and detractors answered 0 to 6. The official method subtracts the detractor percentage from the promoter percentage and ignores passives in the subtraction. The result runs from -100 to +100.
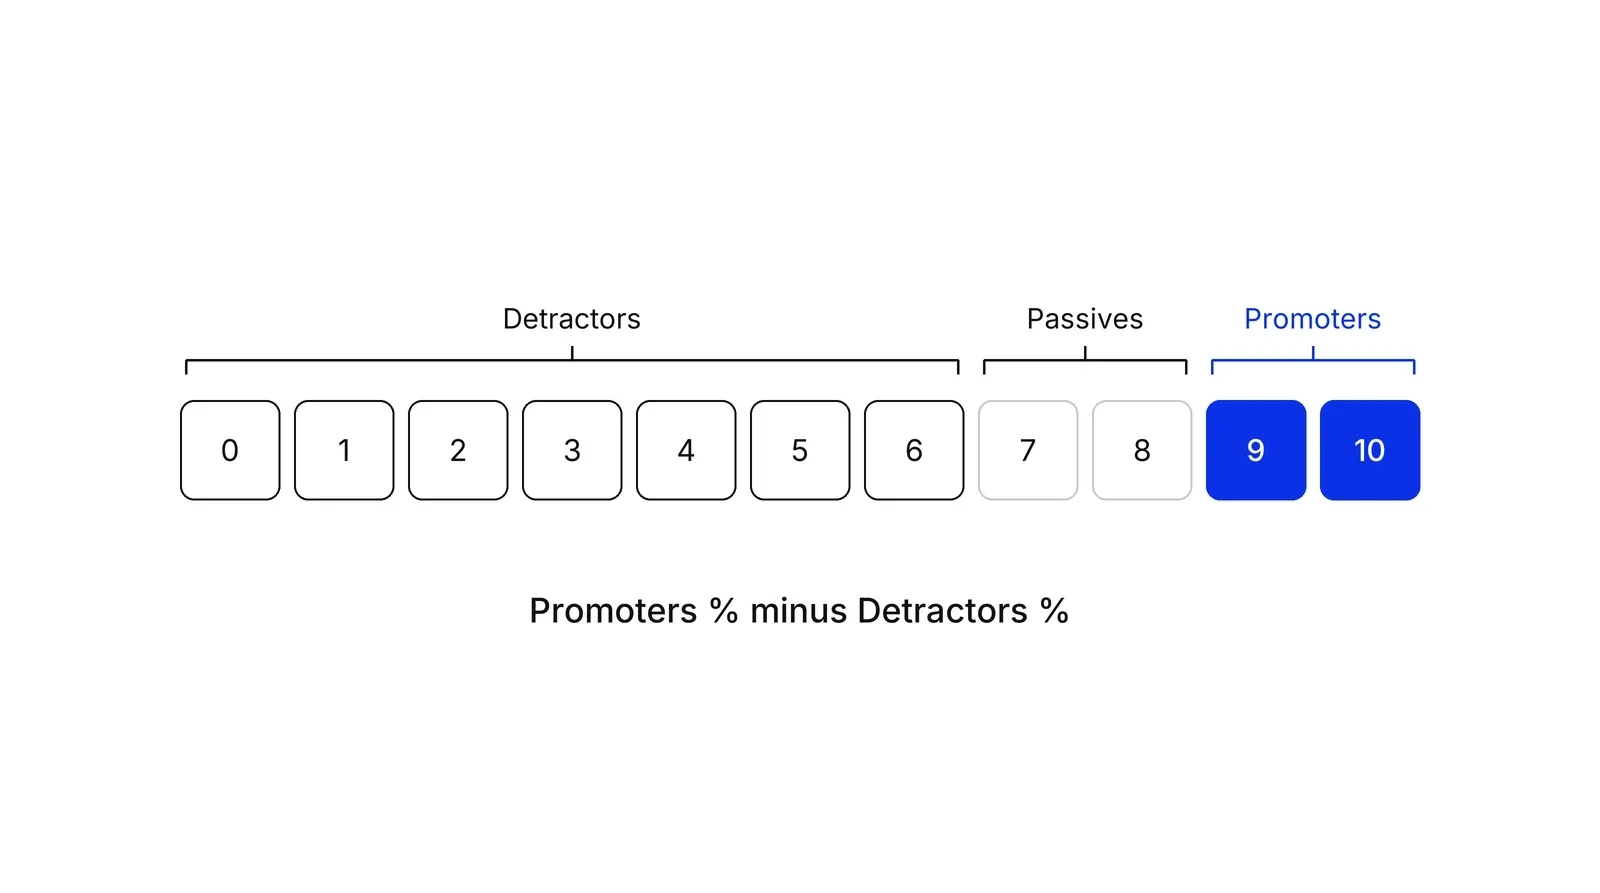
Take 400 responses: 160 promoters, 160 passives, 80 detractors. Promoters are 40%, detractors 20%, so NPS is +20. Report the three percentages with the score. Without them the number hides what is going on.
The system around the score
Bain argues the score is the smallest part. In its Net Promoter System, feedback goes back quickly to the employees responsible for the experience, and the company follows up with customers. Rob Markey of Bain separates an inner loop, where frontline teams learn from customer feedback and fix what they control, from an outer loop, where a customer advocacy office ranks cross-team problems and assigns an owner. The claims Bain makes about growth for companies that run the system come from Bain itself, without public data behind them.
What research found
The academic response started within four years of the article. Four findings matter most.
Timothy Keiningham and colleagues tested the claim in the Journal of Marketing in 2007, using Norwegian customer satisfaction barometer data and a reanalysis of Reichheld’s own figures. Per a MeasuringU summary, NPS was the best or second-best predictor in two of five industries and comparable to satisfaction in the reanalysis. The paper won the 2007 H. Paul Root Award, though its lead author worked at Ipsos Loyalty, and the team’s own account of the work is in an Ipsos interview.
Neil Morgan and Lopo Rego’s 2006 Marketing Science study of 80 US firms found average satisfaction was the strongest predictor of business outcomes, with the authors’ NPS proxy not significant. That proxy used two other survey items, so it is a weaker test. A 2024 study by Jaramillo and colleagues found both NPS and satisfaction predict financial performance, with satisfaction explaining slightly more.
Grisaffe pointed out that Reichheld’s growth data ran from 1999 to 2002 but his survey started in 2001, so the survey could not fully predict what came before it, and that correlation does not show recommending causes growth. Kristensen and Eskildsen found the groupings did not match the clusters in their Danish insurance data. Statisticians Fisher and Kordupleski say the score cannot show root causes. A J.D. Power study by Pingitore and colleagues, summarised by MeasuringU, found net metrics of any kind usually are not the strongest customer measures, with results that differed by industry.
Baehre and colleagues tracked seven US sportswear brands for five years and found only a brand-health version of NPS, asking all potential customers rather than current ones, predicted sales growth. Mecredy and colleagues found promoters spend more, but are a small part of revenue growth. MeasuringU concludes the metric is qualified, not discredited. Byron Sharp’s sharper critique was a commentary, not peer reviewed.
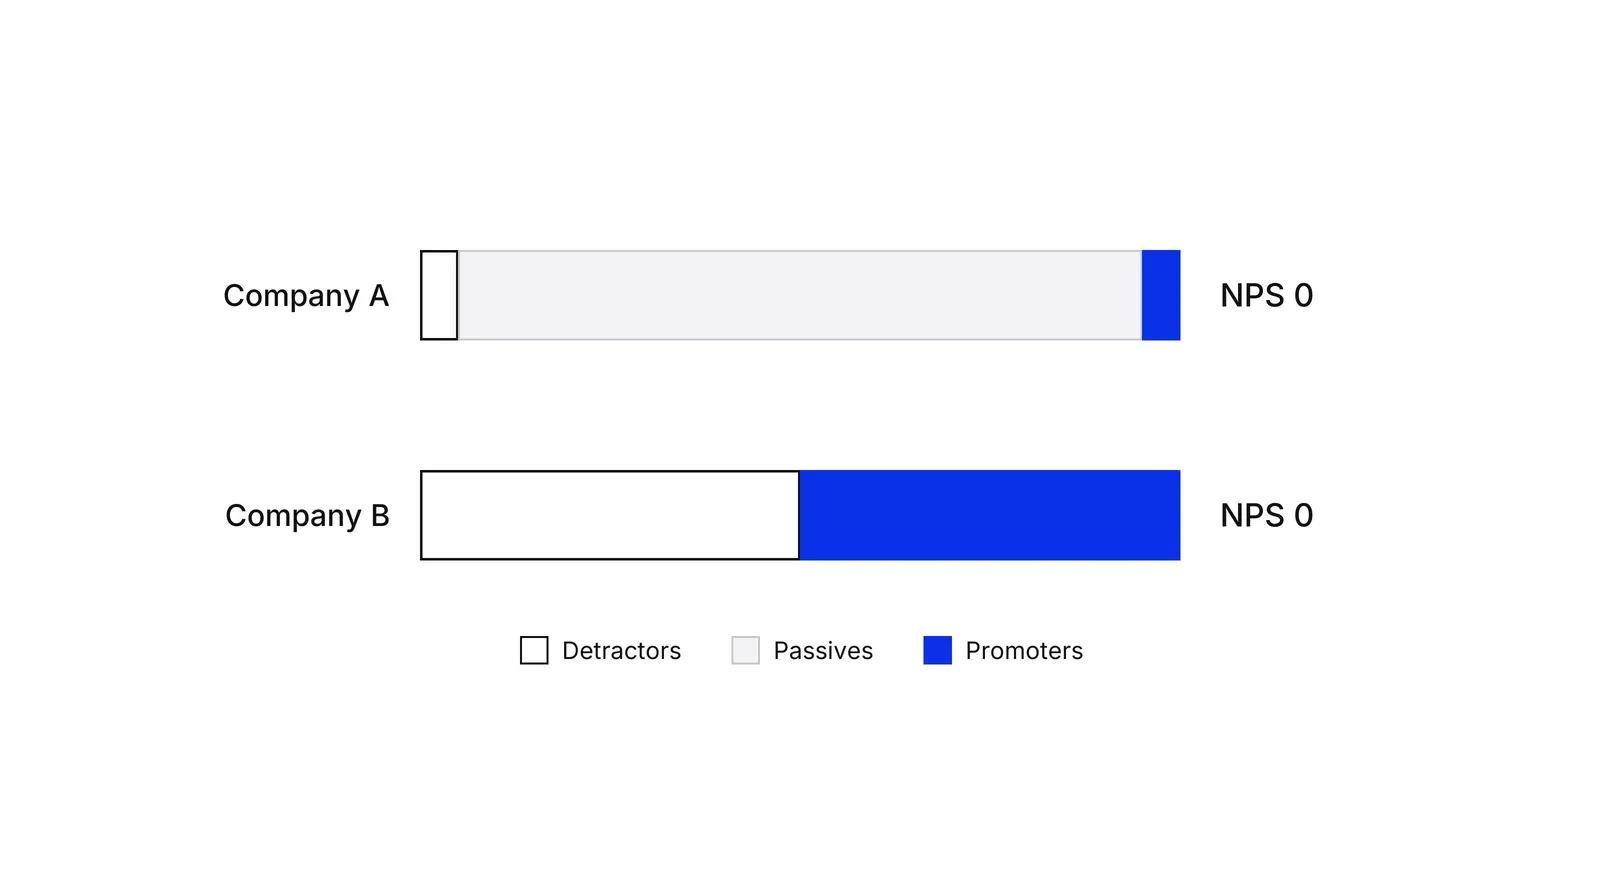
The figure shows a point Grisaffe made. Company A has 5% promoters, 90% passives and 5% detractors. Company B has 50% promoters and 50% detractors. Both score zero, but they need opposite responses.
Where it misleads
Three limits come up repeatedly. First, grouping loses information: Nielsen Norman Group notes that a customer moving from 2 to 5 is still a detractor. Second, comparisons break down. A 2022 review of NPS in healthcare found scores vary by condition, age and culture, and that the metric suits settings where patients can choose their provider. Third, tying the number to targets invites gaming.
NPS also answers a different question from CSAT and CES, which are asked right after a single interaction. If you want the broader picture of what customers say, pair it with voice of customer research, and if you want a version that includes non-customers, see brand health tracking. After a bad score, customer success is the team that usually acts.
A marketing operational system is a reasonable place to keep the three percentages, the response counts and the owner of each detractor follow-up.
How to apply Net Promoter Score (NPS), step by step
- Fix the question and the scale. Ask 'How likely are you to recommend us to a friend or colleague?' on a 0-to-10 scale, with 0 as not at all likely and 10 as extremely likely. Do not reword it from one survey to the next. Result: one question that stays comparable across quarters.
- Choose who you ask and when. Decide whether you ask customers after a transaction, on a fixed relationship schedule, or a sample of the whole market. Each choice measures something different, so pick one and keep it. Result: a written sampling rule.
- Add one open question. Right after the score, ask 'What is the main reason for your score?' as free text. Result: a reason attached to every number.
- Group the answers and calculate. Count 9 and 10 as promoters, 7 and 8 as passives, 0 to 6 as detractors. Divide each group by all responses, then subtract the detractor percentage from the promoter percentage. Result: one score between -100 and +100, with the three percentages kept next to it.
- Contact the detractors. Reach out to every detractor who agreed to be contacted and ask what went wrong. Route patterns to the team that owns the cause. Result: a short list of root causes, each with an owner.
- Track the three groups, not only the score. Report promoters, passives and detractors every period, plus the response count. Result: a trend you can read without guessing what moved.
Examples
A dental clinic after a treatment plan
Illustrative. A clinic sends the question to 200 patients a quarter and 200 reply: 110 answer 9 or 10, 60 answer 7 or 8, 30 answer 0 to 6. Promoters are 55%, detractors 15%, so NPS is +40. The open answers show that most detractors waited more than 20 minutes at reception, which points to scheduling rather than clinical quality.
A payments fintech after onboarding
Illustrative. A payments company asks 500 new business customers 30 days after onboarding: 150 promoters, 175 passives, 175 detractors. Promoters are 30%, detractors 35%, NPS is -5. Comments from detractors repeat one theme, a slow document check, so the team fixes that step before touching anything else.
When to use it
Use it to track the overall relationship with customers who can choose between you and an alternative, at regular intervals, when you have the means to follow up on the answers. It works as an early warning light that tells you where to look.
When not to use it
Skip it as the only measure of an interaction, where CSAT and CES fit better. Be careful where customers have no choice, for example some public services or an employer-mandated system. Do not use it to compare teams or countries without checking that the sample and culture are comparable, and do not tie bonuses to the number.
Common mistakes
- Reading the score without the three percentages. Very different customer bases can produce the same NPS.
- Asking after a single interaction and calling the result relationship loyalty. That measures a moment, not the relationship.
- Tying pay or targets to the number, which invites gaming the sample and pressuring customers for a 9 or 10.
- Comparing against an industry benchmark without checking sample, timing and culture, since scores differ by all three.
- Collecting scores and never contacting detractors, so the survey produces a chart and no change.
FAQ
How do you calculate NPS?
Ask how likely customers are to recommend you, from 0 to 10. Count answers of 9 or 10 as promoters and 0 to 6 as detractors, ignoring 7 and 8 in the subtraction. Divide each group by total responses and subtract the detractor percentage from the promoter percentage. The result runs from -100 to +100.
What is a good NPS?
There is no universal threshold. Reviews of NPS in healthcare and UX research report that scores vary by industry, country and context, so comparisons across them are unreliable. A more defensible target is your own trend, tracked with the same question, sample and timing.
Does NPS predict growth?
The evidence is mixed. Reichheld reported a strong link in 2003. Keiningham and colleagues (2007) found NPS was not a clear winner over satisfaction measures, while a 2022 study of seven sportswear brands found only a brand-health version, surveying all potential customers, predicted sales growth.
What is the difference between NPS, CSAT and CES?
NPS asks about recommending the company and covers the whole relationship. CSAT and CES are asked right after one interaction and cover satisfaction and effort. They answer different questions, so many teams use all three. The CSAT and CES page explains how the transactional pair works.
Who owns the NPS trademark?
The Net Promoter System site states that Net Promoter, NPS and Net Promoter System are registered trademarks of Bain & Company, NICE Systems and Fred Reichheld, and that Net Promoter Score is a service mark of the same three parties. Using the question and the method internally is common practice.
Sources
- Fred Reichheld, The One Number You Need to Grow, Harvard Business Review, December 2003
- Net Promoter System, About Net Promoter (history and trademarks)
- Net Promoter System, Measuring your Net Promoter Score
- Bain & Company, Introducing the Net Promoter System
- Rob Markey, Bain & Company, The Net Promoter System's outer loop, 2015
- Fred Reichheld and Rob Markey, The Ultimate Question 2.0, Harvard Business Review Press, 2011
- Ipsos, A Longitudinal Examination of Net Promoter and Firm Revenue Growth wins the 2007 H. Paul Root Award
- Ipsos, The Net Promoter debate, interview with the Keiningham research team, 2007
- MeasuringU, summary of Keiningham et al., A Longitudinal Examination of Net Promoter and Firm Revenue Growth, Journal of Marketing, 2007
- MeasuringU, summary of Morgan and Rego, The Value of Different Customer Satisfaction and Loyalty Metrics, Marketing Science, 2006
- Douglas B. Grisaffe, Questions about the Ultimate Question, Journal of Consumer Satisfaction, Dissatisfaction and Complaining Behavior 20, 2007
- MeasuringU, summary of Pingitore et al., The Single-Question Trap, 2007
- MeasuringU, summary of Kristensen and Eskildsen, Is the NPS a trustworthy performance measure?, The TQM Journal, 2014
- Nicholas Fisher and Raymond Kordupleski, What's Wrong with Net-Promoter Score? (preprint of the 2019 paper in Applied Stochastic Models in Business and Industry)
- MeasuringU, summary of Byron Sharp, Net Promoter Score Fails the Test, 2008
- MeasuringU, Has the Net Promoter Score Been Discredited in the Academic Literature?
- Sven Baehre, Michele O'Dwyer, Lisa O'Malley, Nick Lee, The use of Net Promoter Score (NPS) to predict sales growth, Journal of the Academy of Marketing Science 50, 2022
- Philip Mecredy, Malcolm Wright, Pamela Feetham, Are promoters valuable customers?, Australasian Marketing Journal 26(1), 2018
- Susana Jaramillo, George Deitz, John Hansen, Emin Babakus, Taking the Measure of Net Promoter Score, International Journal of Market Research 66, 2024
- Corey Adams, Ramesh Walpola, Anthony Schembri, Reema Harrison, The ultimate question? Evaluating the use of Net Promoter Score in healthcare, Health Expectations, 2022
- Nielsen Norman Group, Net Promoter Score in UX
Last updated Oct 9, 2026


The compliance layer under fintech marketing operations
A fintech marketing agency can build campaigns. It cannot own the compliance review, the KYC drop-off or the multi-market licensing rules that decide whether a lead ever becomes a customer.

Fractional CMO: what you get, and what has to exist underneath
A fractional CMO brings strategy and judgment. Without reporting, CRM hygiene and a named owner per number, the engagement produces a slide deck instead of a system.

The operations layer behind healthcare patient acquisition
Ads and search bring the request in. What happens between the click and the booked, attended visit decides whether the spend paid off.