Customer journey analytics
Customer journey analytics joins event data from every channel on one person ID, so a team can see the paths customers actually take, where they stall and which sequences end in an outcome.
Customer journey analytics is the analysis of behavior data from every channel a customer uses, joined on one person ID, to show the paths people actually take, where they stall and which sequences end in a purchase or a loss. It starts from logged events, not workshops, and unlike a funnel it does not fix the steps in advance.
- Origin
- Practice, no single inventor (term used in service research by Halvorsrud, Kvale and Følstad; productized by analytics vendors), 2010s
- Level
- 401 · Expert
- Fits
- Scale-up, Enterprise
- Time to apply
- Two to four weeks for a first cross-channel view, most of it spent on identity and data joins
- What you need
- event-level data from two or more channels, such as web and call center · a person ID that appears in more than one source · one business outcome to anchor on · an analyst who can read raw event tables
Customer journey analytics is the analysis of event data from every channel a customer touches, joined on a person ID, to find the sequences people actually follow before an outcome. The unit is the person, not the visit or the device. The output is a set of counted paths: which are common, which end in a purchase, which end in silence.
No single inventor owns the term. In service research, Ragnhild Halvorsrud, Knut Kvale and Asbjørn Følstad described “customer journey analysis” in the Journal of Service Theory and Practice in 2016 as a way to compare the planned service with the one customers actually experienced across channels. A year later, at the CAiSE 2017 Forum, Gaël Bernard and Periklis Andritsos of the University of Lausanne, who screened 69 articles from Scopus, IEEE Xplore, DBLP and Web of Science and kept 13, argued that logged event data, read with process mining, could give journey maps the decision-making measures they lacked. Vendors such as Adobe later built products around the idea, and Adobe Experience League describes it as Analysis Workspace combined with data from Experience Platform, stored in the Experience Data Model (XDM) and queryable with SQL through Query Service.
How is it different from a journey map and a funnel?
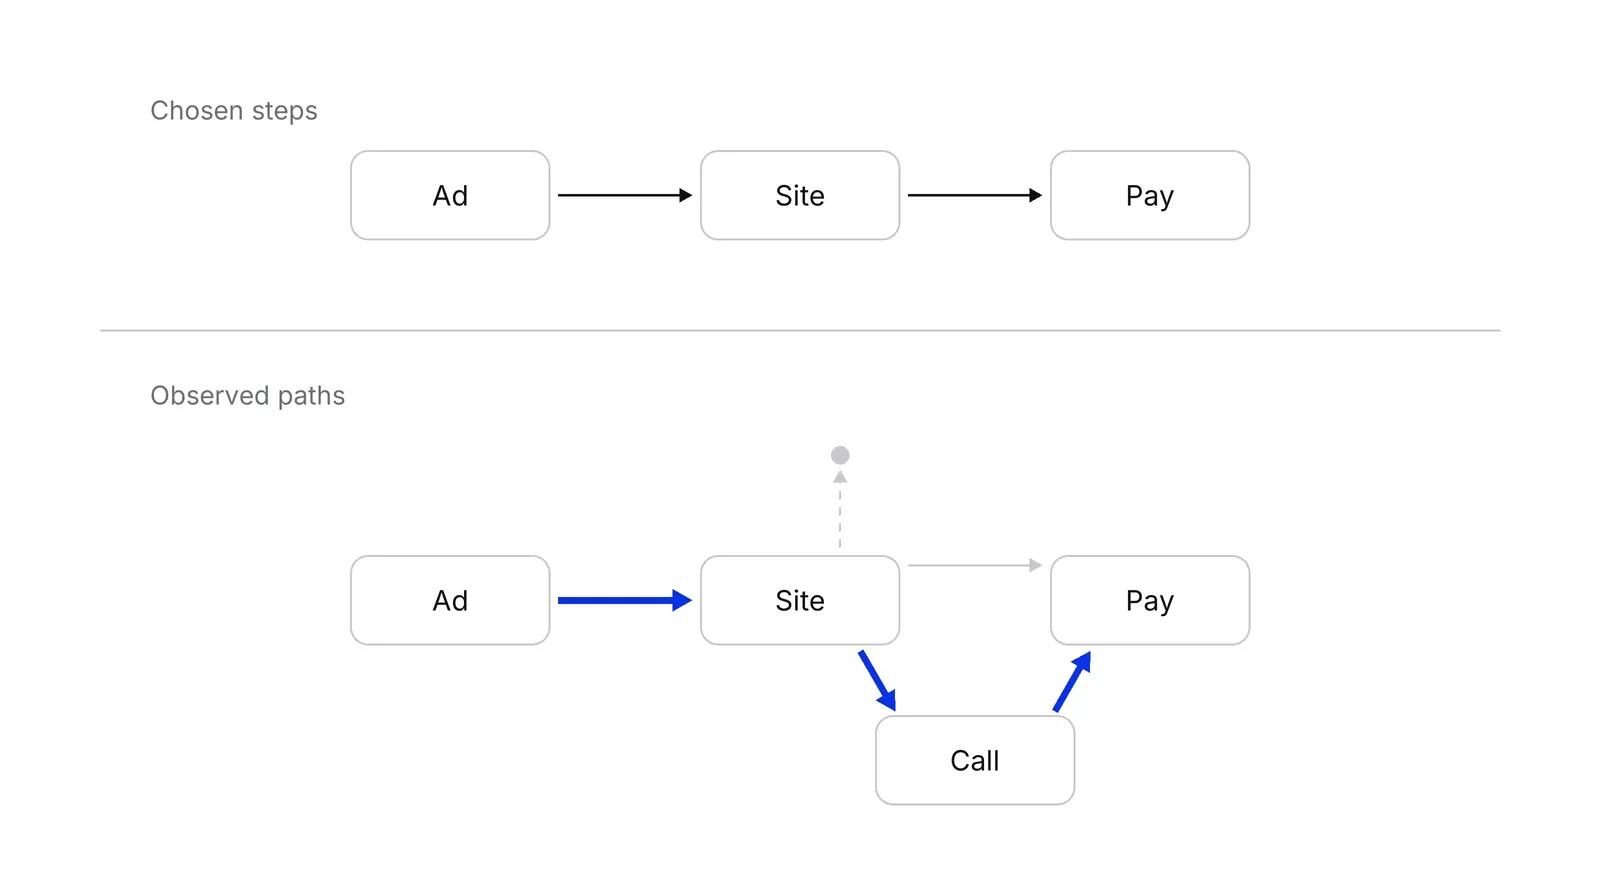
It is the quantitative layer between two older tools. A customer journey map is qualitative: it shows what one customer does, thinks and feels, based on interviews and workshops. Funnel analysis is quantitative but narrow: it counts people through steps you chose in advance. Journey analytics sits between them.
| Journey map | Funnel analysis | Journey analytics | |
|---|---|---|---|
| Source | Interviews, workshops, support logs | Events from one tracked flow | Events from every channel, joined by person |
| Steps | Drawn by the team | Defined in advance | Discovered in the data |
| Answers | How does it feel, and why? | Where do people drop off? | Which paths do people take, and where do they go next? |
The three work in order. The map gives hypotheses, a path view finds the sequences that matter, and a funnel then measures the one you pick. The Forrester view is similar. In a January 2026 post based on 30 buyer interviews, Joana de Quintanilha writes that journeys pay off when tied to customer data and business metrics, and that otherwise the return stays anecdotal.
Identity comes first
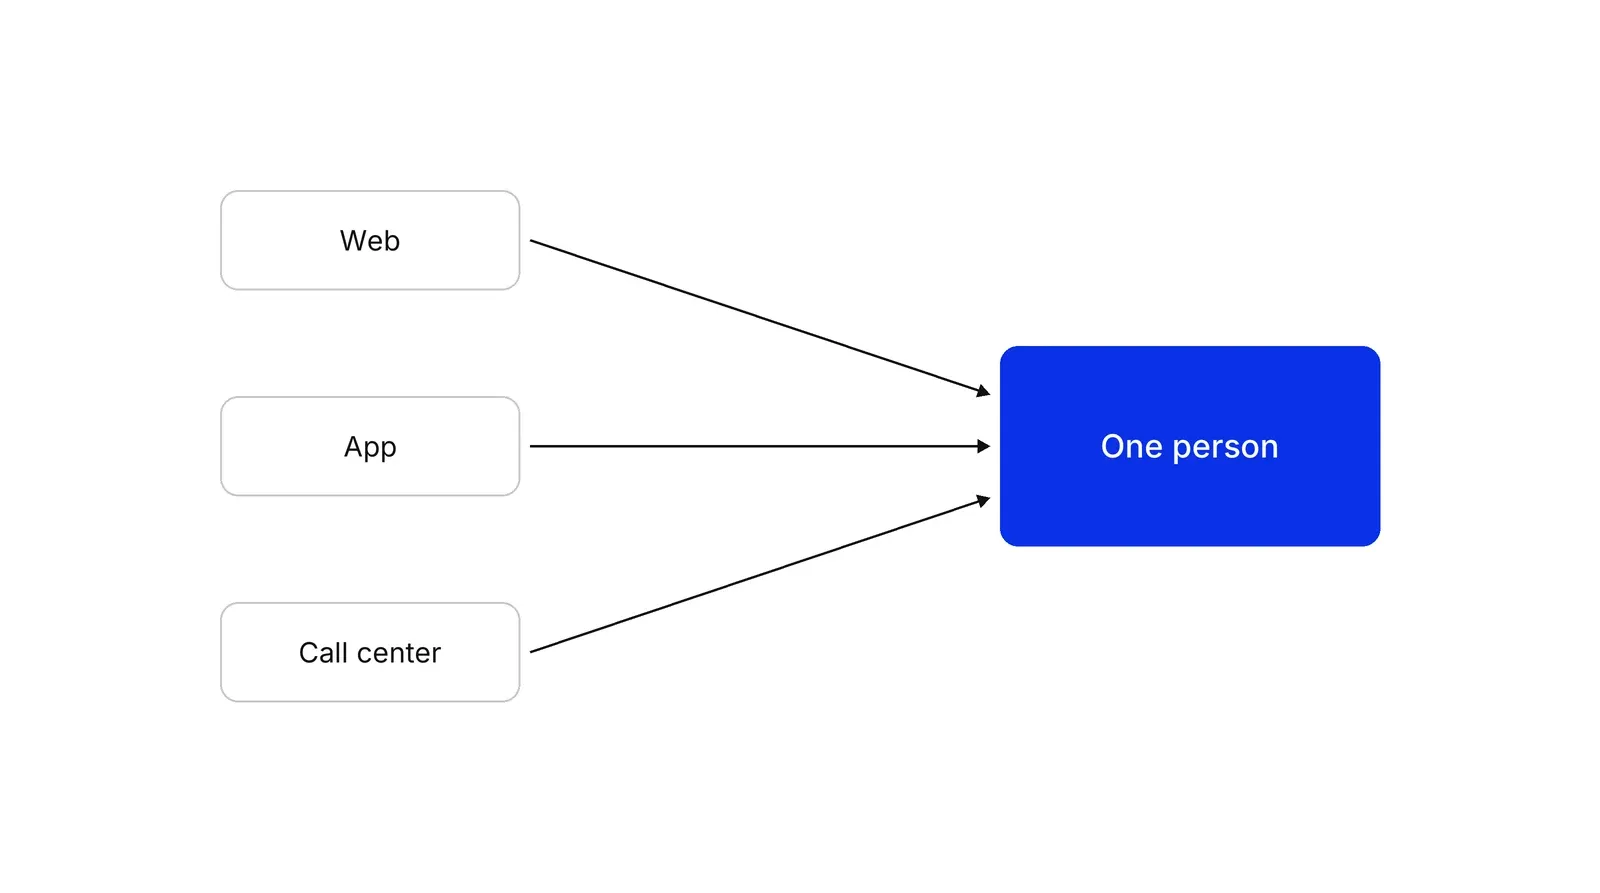
The hard part is joining sources. A web tool sees a cookie, an app sees a device, and a call center sees a phone number, so one person looks like three strangers.
Tools solve this with an identifier you supply. In Google Analytics 4, User-ID links one person’s activity across sessions and devices, and the reporting identity setting decides whether reports use User-ID, then device ID, then modeling. Adobe Customer Journey Analytics calls the join stitching: it re-keys events so a person ID appears on more rows, and its example links an ad-driven web visit to a later call center event. Datasets are combined in a connection that needs the same Person ID, and the value is case sensitive, so two spellings of one ID make two people.
Each tool sets limits you should know before planning the join. A Google Analytics 4 User-ID must be 256 characters or less and must not contain information a third party could use to identify the person. Adobe Customer Journey Analytics stitching allows 5 datasets on the Select package, 15 on Prime and 50 on Ultimate. One connection holds up to 100 datasets.
Yandex Metrica’s ClientID, by contrast, is associated with a browser, so the same person on another browser looks like a different user unless you add your own link.
Which views show the paths
A path view starts from one event and shows what comes next or what came before. Google Analytics 4 path exploration takes a starting point or an ending point, not both, shows five nodes per step by default, up to 20, and folds the rest into “Others”. A new session starts after 30 minutes of inactivity. Adobe’s Flow suits exploratory work on non-linear journeys with several entry points.
A fallout view takes a sequence you define and shows where people leave it. Adobe’s Fallout fits linear journeys with one entry point, compares two segments side by side, and shows where people go after they drop. This is the funnel, reached through the path view. Google Analytics 4’s funnel exploration takes up to 10 steps. Yandex Metrica’s Funnels report offers a window of up to 360 days, conversion from the first step or from the previous step, and up to seven groupings, with up to three conditions per step.
A canvas view lets you draw a branching journey and count who eventually moves between nodes. Adobe’s Journey canvas does this and names the path with the highest conversion rate. Google Analytics 4 adds Pathing and Attribution reports in its Advertising section, which assign credit to touchpoints along a user’s path to key events.
For teams that want more control, Yandex Metrica Pro can export non-aggregated session data into a ClickHouse cluster in Yandex Cloud, where per-user chains of traffic sources can be counted under numbered attribution models, including last click (1), last non-direct click (2) and first click (3). Yandex notes that 99% of sessions conclude within 3 days of their start.
The lender example, step by step
Take the illustrative lender again. The web funnel reads 4,000 of 10,000, or 40%, the way a funnel exploration counts. The 6,000 who stopped include 1,500 who phoned, one in four. Of those 1,500, 900 finished by phone, 60% of the callers and 9% of everyone who started. Add 900 to 4,000 and divide by 10,000 to get 49%, the count a shared Person ID makes possible. The other 5,100 either never returned or came back through a channel the join does not cover.
What the research says about paths
In a clickstream study of an online bookseller, published in Marketing Science in 2004, Alan Montgomery and colleagues found that a model with memory of earlier pages predicted a user’s path better than traditional multinomial probit and first-order Markov models, and that purchasers could be flagged with over 40% accuracy after six page views, against a 7% benchmark conversion rate.
Paths also change how credit is given. Eva Anderl and colleagues modeled paths as Markov walks in the International Journal of Research in Marketing in 2016, using four large customer-level datasets with at least seven online channels each, and reported results that differ substantially from last-click attribution. Hongshuang Li and P. K. Kannan built a three-level model of channel consideration, visits and purchase, and tested it in a field study in which the firm turned off paid search for a week.
Halvorsrud and colleagues, working with Telenor on mobile broadband onboarding, rebuilt individual journeys from interviews, diary studies and process tracking, and found four kinds of deviation between planned and delivered service: ad hoc touchpoints, out-of-order touchpoints, failed touchpoints and missing ones. Bernard and Andritsos store a journey as XML built on the IEEE XES format that process mining software reads, so a designed journey and a logged one can be compared. Daan Weijs and Emiel Caron applied process mining to an e-commerce case in 2022 to compare the journey a business intends with the journey customers take. Katherine Lemon and Peter Verhoef describe customers meeting firms through touch points in multiple channels and media, which is why the join matters.
Where it breaks
A path shows the order of events, not their cause. Someone who calls after the pricing page may have been going to call anyway. To know whether a step changes the outcome, run an incrementality test with a held-out group.
Identity gaps cut paths short: logged-out visits, a second browser and withheld consent all end a timeline early. Google Analytics 4 also withholds some rows below minimum aggregation levels, and a widened date range reduces the effect.
Paths are only as good as the events behind them, which is why a written event tracking plan comes first. A regular review of the paths fits naturally into a Marketing-Operational System.
How to apply Customer journey analytics, step by step
- Choose the outcome and the people. Pick one outcome, such as a funded account or a kept appointment, and the group in scope, such as everyone who opened an application in the last 90 days. Result: one sentence that defines the journey.
- List the sources and their IDs. Write down every system that records a touchpoint, such as website, app, call center and CRM, and the person identifier each stores. Result: a table of which sources can be joined.
- Join the sources on a person ID. Use the most widely shared ID, usually a login or customer number, to merge events into one timeline per person. Anonymous visits stay at device level until a login links them. Result: one timeline per person.
- Read paths before defining funnels. Open a path view backwards from the outcome and forwards from the first touch, and note common and unexpected sequences. Result: a short list of paths nobody had drawn.
- Turn the strongest path into a funnel. Take the path carrying the most people or revenue and fix it as steps, so a funnel report can measure drop-off at each. Result: a funnel built from observed behavior.
- Compare expected and actual, then test. Set the journey your team designed beside the one in the data, pick the largest gap and test a change as an experiment. Result: one change with a baseline and a result.
Examples
A lender's application, counted by person
Illustrative: a lender sees 10,000 applications started on its site, the first step of a [funnel exploration](https://support.google.com/analytics/answer/9327974?hl=en), and 4,000 submitted, a 40% completion rate. After joining call-center records on the customer number, the kind of [stitching Adobe documents](https://experienceleague.adobe.com/en/docs/analytics-platform/using/stitching/overview) for a web visit and a later call, 1,500 of the 6,000 who stopped had phoned within a week, and 900 completed the application by phone. By person, 4,900 of 10,000 finished, 49%. The web-only funnel understated completion by nine points and pointed the team at the wrong problem.
A clinic's ad-to-visit path
Illustrative: a clinic sees 2,000 people click an ad. Online booking records 160 bookings, 8%. Joining the front-desk call log, as a [User-ID in GA4](https://support.google.com/analytics/answer/9213390?hl=en) allows for logged-in visitors, adds 140 people who visited the pricing page and then phoned to book. Across both channels, joined on a shared [Person ID](https://experienceleague.adobe.com/en/docs/analytics-platform/using/cja-connections/create-connection), 300 of 2,000 booked, 15%. The call is part of the journey, and the pricing page is what sends people to it.
When to use it
Use it when customers move between channels before the outcome, such as web, app, then phone, and no single tool shows the whole path, and the team already tracks events and holds a shared customer ID.
When not to use it
Skip it when only one channel matters, no ID links the sources, or traffic is too thin for paths to repeat. A funnel report and a few customer interviews teach early teams more.
Common mistakes
- Buying a tool before checking which sources share a person ID, so the join fails and the tool shows three disconnected funnels.
- Reading a common path as a cause. A path shows the order of events; a held-out test shows whether a step changed the outcome.
- Merging anonymous and logged-in data without checking consent rules, or missing that case-sensitive IDs split one person into two.
- Drawing conclusions from a path with a few dozen people, or from rows withheld for privacy thresholds.
- Running the analysis once instead of reviewing it regularly against the same outcome and people.
FAQ
What is customer journey analytics?
Customer journey analytics joins behavior data from several channels on a person ID, then analyzes the sequences people follow before an outcome. It shows common paths, drop-off points and the channels involved, from logged events instead of workshops.
What is the difference between customer journey analytics and a customer journey map?
A customer journey map is a qualitative picture of what one customer does, thinks and feels, built from interviews and workshops. Journey analytics is quantitative, built from logged events across thousands of people. The map suggests where to look; the analytics counts who takes each path.
How is customer journey analytics different from funnel analysis?
Funnel analysis counts people through steps you define in advance toward one outcome. Journey analytics starts from the data and shows which steps people actually take, including branches, loops and other channels. A path view finds sequences, and a funnel then measures the one you choose.
Can I do customer journey analytics in Google Analytics 4?
Partly. Google Analytics 4 has path exploration and funnel exploration, and User-ID can link devices. It only sees data sent to Analytics, so offline events such as calls must be imported or joined elsewhere, for example in a warehouse, to cover the full journey.
What data do you need for customer journey analytics?
You need event-level data with a timestamp and an identifier from each channel, plus a person ID that appears in more than one source, such as a login or customer number. Without a shared ID, each channel stays a separate set of anonymous visits.
Sources
- Google, [GA4] Key events and attribution reports, Analytics Help
- Google, [GA4] Path exploration, Analytics Help
- Google, [GA4] Funnel exploration, Analytics Help
- Google, Reporting identity, Analytics Help
- Google, Measure activity across platforms with User-ID, Analytics Help
- Google, [GA4] Data thresholds, Analytics Help
- Adobe, Customer Journey Analytics overview, Experience League
- Adobe, Stitching overview, Experience League
- Adobe, Create a connection, Experience League
- Adobe, Flow visualization, Experience League
- Adobe, Fallout visualization, Experience League
- Adobe, Journey canvas, Experience League
- Yandex, Funnels report, Metrica Help
- Yandex, Users and customers, Metrica Help
- Yandex, Working with exported data, Metrica Help
- A. L. Montgomery, S. Li, K. Srinivasan, J. C. Liechty, Modeling Online Browsing and Path Analysis Using Clickstream Data, Marketing Science, 2004
- E. M. Anderl, I. Becker, F. von Wangenheim, J. H. Schumann, Mapping the customer journey: Lessons learned from graph-based online attribution modeling, International Journal of Research in Marketing, 2016
- H. Li, P. K. Kannan, Attributing Conversions in a Multichannel Online Marketing Environment, Marketing Science Institute working paper
- R. Halvorsrud, K. Kvale, A. Følstad, Improving service quality through customer journey analysis, Journal of Service Theory and Practice, 2016
- G. Bernard, P. Andritsos, A Process Mining Based Model for Customer Journey Mapping, CAiSE Forum, 2017
- D. Weijs, E. Caron, Customer Journey Analytics: A Model for Creating Diagnostic Insights with Process Mining, ICSOFT, 2022
- K. N. Lemon, P. C. Verhoef, Understanding Customer Experience Throughout the Customer Journey, Journal of Marketing, 2016
- Forrester, Customer Journey Management In 2026: From Maps To Measurable Impact
Last updated Oct 9, 2026


Marketing agency or growth system: when a company outgrows its agency
An agency is the right call while the founder still runs most of the company. Once the business starts copying itself into new locations or markets, it needs a system that sets goals, tests hypotheses and owns the result.

Why healthcare marketing agencies stall: the short, mid and long wins model we use with clinics
Most agencies own the click and nobody owns the front desk. How we structure clinic work in three horizons, the research behind each one, and one year of results.

Why channel tests stall after month three
Most paid channel tests do not end with a decision. They end when the budget runs out, the attribution model changes, or everyone quietly stops looking at the dashboard.