Sequential and Bayesian testing
Sequential and Bayesian testing are ways to read an A/B test before its planned end: sequential methods adjust the significance threshold so repeated looks keep false positives at 5%, and Bayesian methods report the probability that a variant is better, which does not by itself control false positives.
Sequential testing is a family of A/B test designs that let you check results repeatedly and stop early while keeping the false positive rate at the level you planned, using stricter thresholds at early looks. Bayesian A/B testing reports the probability that a variant beats control. It is easier to read, but checking it daily and stopping at 95% still produces false winners.
- Origin
- Abraham Wald (sequential probability ratio test); Stuart Pocock, Peter O'Brien and Thomas Fleming (group sequential designs); Herbert Robbins (mixture tests); Ramesh Johari, Leo Pekelis and David Walsh (always-valid inference for A/B tests), 1945; 1977 to 1983; 1970; 2015
- Level
- 401 · Expert
- Fits
- Scale-up
- Time to apply
- An hour to choose a design and write the stopping rule; no extra time per test once your platform supports it
- What you need
- a fixed-horizon sample size for the test, from your usual power calculation · an experimentation tool or analyst that can apply sequential boundaries or always-valid p-values · a written stopping rule agreed before launch
Sequential testing is a set of A/B test designs that let you look at results while the test runs and stop early, without raising the false positive rate above what you planned. Bayesian A/B testing is a different way of reporting a test: instead of a p-value, it gives the probability that the variant beats control and how much you stand to lose if you pick wrong.
Both answer the same question growth teams ask in the second week of every test: can we call it now? The sequential answer is older than web testing. Abraham Wald published the sequential probability ratio test in 1945, and medical trials adopted planned interim looks in the late 1970s. Bayesian calculators for web tests appeared around 2014, from Evan Miller and Chris Stucchio among others. This page explains how each works, what it costs and where it misleads. It assumes you already know how to size a fixed test, which the minimum detectable effect page covers.
Why does peeking break a standard A/B test?
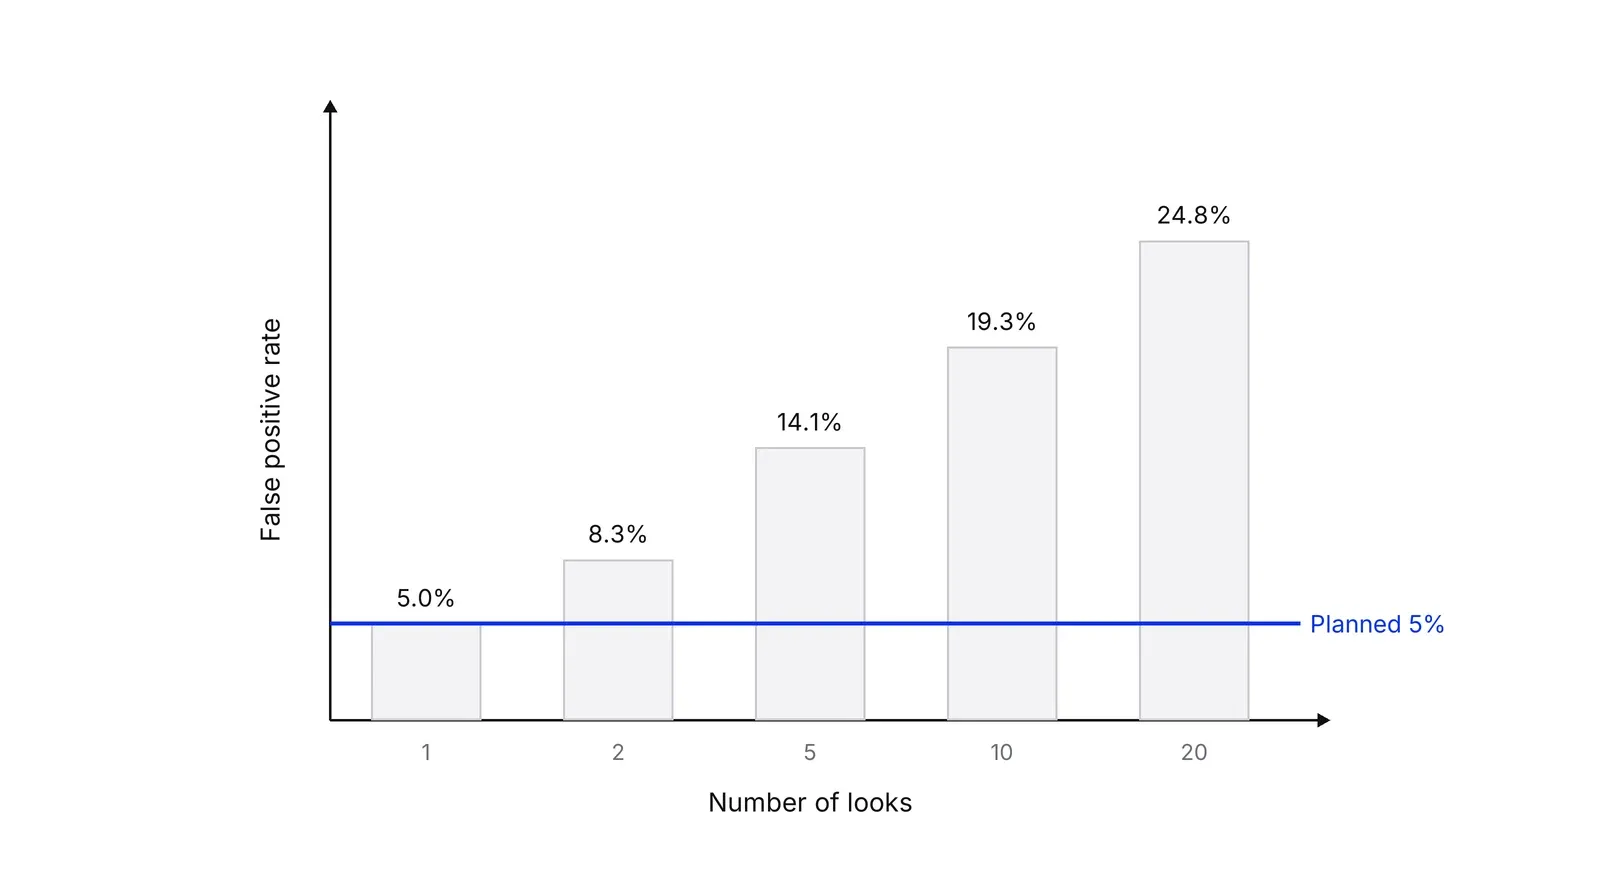
A standard test promises a 5% false positive rate for one look at a sample size fixed in advance. Every extra look gives random noise another chance to cross the line, and a test that stops the first time it crosses keeps the false win. Peter Armitage and colleagues measured this in 1969. We recomputed it with 2 million simulated tests in which the variant does nothing:
Vendors have made this error too. Optimizely’s first results page updated in near real time, and the company at the time recommended stopping once a result was significant, as Ron Kohavi, Alex Deng and Lukas Vermeer recall in their 2022 KDD paper. Optimizely later replaced it with Stats Engine, built on the always-valid methods described below.
Group sequential designs: a few planned looks
A group sequential design fixes the number of looks in advance and gives each look its own, stricter threshold, so the total false positive rate stays at 5%. Stuart Pocock proposed a constant threshold in 1977. Peter O’Brien and Thomas Fleming proposed one that starts very strict and relaxes to almost 1.96 at the end. Gordon Lan and David DeMets added alpha spending in 1983, which lets the timing of looks shift without breaking the guarantee.
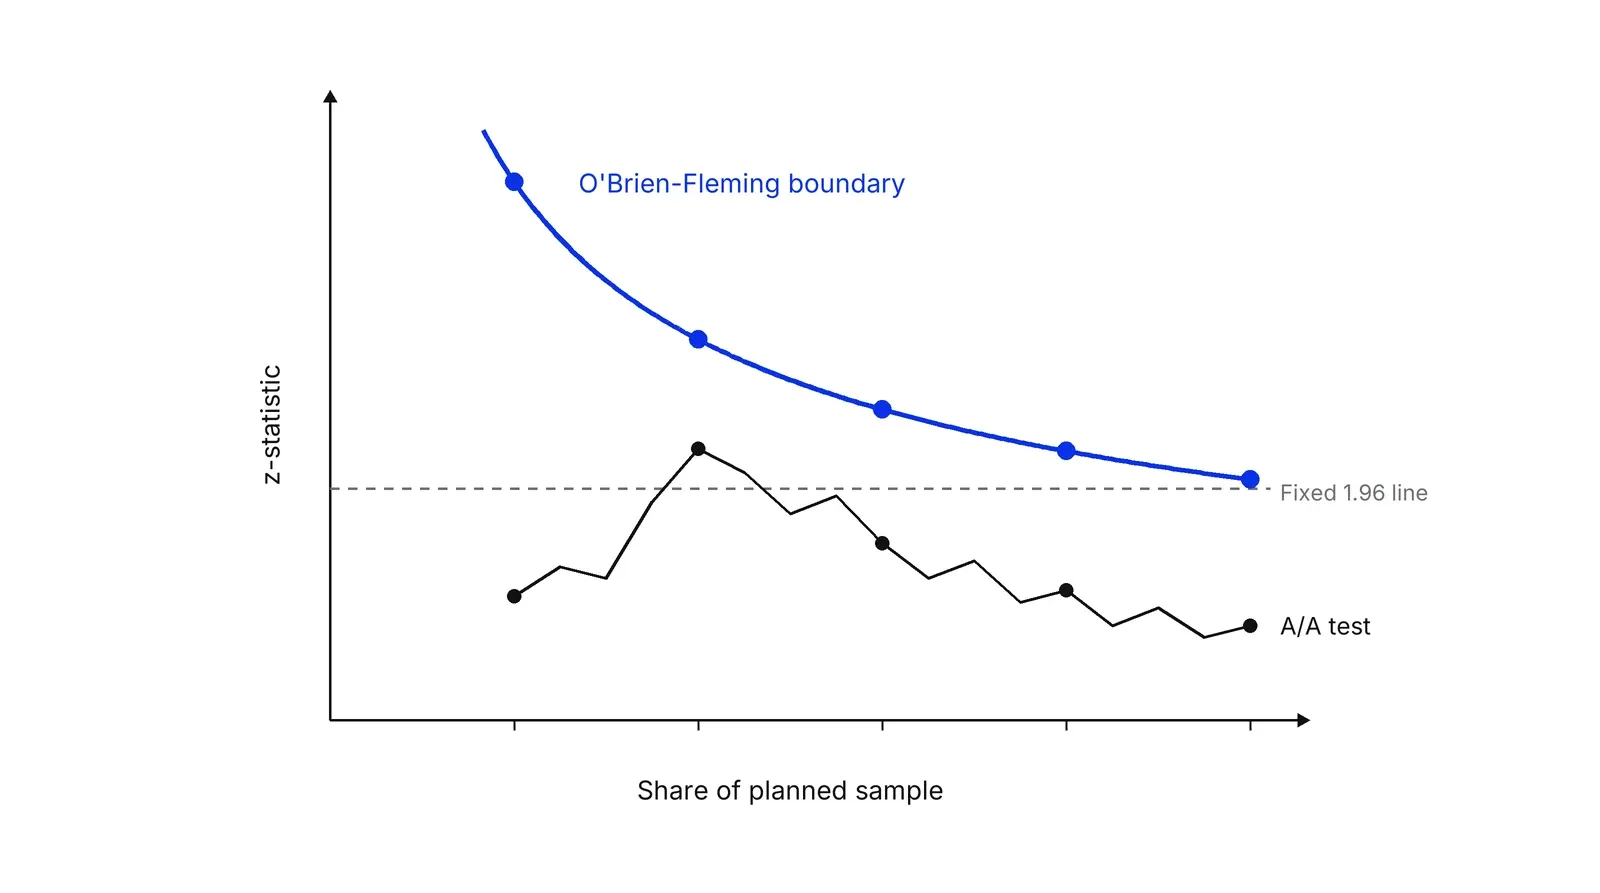
The two boundaries trade risk differently. Our calculation for five equally spaced looks at 5% two-sided significance and 80% power:
| Five looks | z thresholds by look | Maximum sample vs fixed | Expected sample if the effect is real |
|---|---|---|---|
| O’Brien-Fleming | 4.56, 3.23, 2.63, 2.28, 2.04 | +2.8% | 82% |
| Pocock | 2.41 at every look | +22.8% | 80% |
O’Brien-Fleming costs almost nothing when the variant does nothing, so most teams default to it. The FDA’s 2019 guidance on adaptive trials says it “tends to require very persuasive early results,” and estimates that a single halfway look cuts the expected sample by roughly 15% at 90% power. We reproduced that figure: 15.0%.
Spotify picked this family for its platform. In a 2023 comparison, Mårten Schultzberg and Sebastian Ankargren found that with 14 analyses a group sequential test kept 90% power while always-valid methods reached 67% to 72%. The catch is that it needs a good estimate of the maximum sample, and running past it inflates false positives.
Always-valid inference and the mSPRT
Always-valid p-values stay correct no matter when or how often you look, including after every single visitor. Ramesh Johari, Leo Pekelis and David Walsh built them on the mixture sequential probability ratio test (mSPRT), which Herbert Robbins described in 1970. The test asks how much more likely the data are under a spread of possible effects than under no effect, and stops when that ratio passes 1/alpha. Their paper came from work at Optimizely, and the KDD 2017 version reports the method deployed there.
Other platforms followed with close relatives. Statsig uses an mSPRT. GrowthBook uses confidence sequences, intervals that hold at every sample size, in the line of Howard, Ramdas and colleagues. Netflix researchers apply anytime-valid regression tests to its experiments.
The price is power. We simulated a 5% baseline with a true 10% lift and 2,000 users per arm a day, checked daily. A fixed test reaches 80% power on day 16. The mSPRT had stopped with a winner by day 16 in only 50% of runs and needed until day 28 to reach 82%. In return, false positives across 42 daily looks stayed at 1.8%. Always-valid methods suit guardrails and fast kill decisions better than squeezing out a small win.
Bayesian A/B testing and its pitfalls
Bayesian A/B testing combines a prior belief about conversion rates with the data and reports a posterior: the chance the variant is better, and the expected loss if you choose it. Chris Stucchio’s 2014 decision rule stops a test once expected loss falls below a “threshold of caring,” and argues you can stop early if there is a clear winner. That framing is easier to explain to a CFO than a p-value.
The claim that Bayesian tests are immune to peeking does not hold as usually stated. David Robinson simulated Stucchio’s rule in 2015: wrong switches rose from 2.5% to 11.8% with daily peeking, because Bayesian methods never promised to control that rate. Our simulation of a 95% chance-to-win rule on identical variants gave 21% false winners with daily checks, against 5% for one read at the end.
Statisticians still disagree on how much this matters. Jeffrey Rouder argued optional stopping is no problem for Bayesians. Rianne de Heide and Peter Grünwald showed the protection breaks down with default priors, which most tools use. Alex Deng and colleagues proved continuous monitoring is valid only with proper stopping rules.
| Approach | When you may look | What it guarantees | Main cost |
|---|---|---|---|
| Fixed horizon | Once, at the end | 5% false positives | No early stop |
| Group sequential | At planned looks | 5% false positives | Needs a maximum sample |
| mSPRT, confidence sequences | Any time | 5% false positives | Less power at a given sample |
| Bayesian posterior | Any time | A correct summary under your prior | False positives not controlled |
The prior is where Bayesian methods earn their place. Kohavi, Deng and Vermeer estimate that with Airbnb search’s 8% success rate and 80% power, about 26% of significant results are false. Microsoft’s platform reports estimates built on priors from past tests. If your program keeps a log of results, as the experimentation program page describes, you have the data for that prior. Our Growth Lab writes the stopping rule into each HADI loop before launch.
How to apply Sequential and Bayesian testing, step by step
- Decide whether you need to stop early at all. Early stopping pays when a real win is worth shipping fast, when a bad variant costs money every day, or when traffic is expensive. If none applies, run a fixed-horizon test and read it once. Result: a yes or no on sequential design, with the reason written down.
- Pick the design that matches how you look. If you will check on a fixed schedule, such as weekly, use a group sequential design with an O'Brien-Fleming boundary or a Lan-DeMets spending function. If you will check whenever you like or cannot estimate the final sample, use always-valid p-values (mSPRT) or confidence sequences. Result: one named method.
- Set the maximum sample and the looks. Start from the fixed-horizon sample size and add the method's inflation: about 2% for five O'Brien-Fleming looks, about 23% for five Pocock looks. For mSPRT or confidence sequences, set the tuning parameter near the sample at which you expect to decide. Result: a maximum sample, a look schedule and the boundary values.
- Write the stopping rule into the test brief. State what ends the test: crossing the efficacy boundary, crossing a harm boundary on a guardrail, or reaching the maximum sample. Add that nobody stops on an unadjusted p-value or a Bayesian chance to win. Result: a rule anyone can check after the fact.
- Read the test only through the adjusted numbers. At each look, compare the statistic with that look's boundary, or the always-valid p-value with alpha. Ignore the naive p-value the dashboard may also show. Result: a stop or continue decision that keeps the planned error rate.
- Discount the effect size of an early winner. A test that stops at an early look tends to overstate the lift, because it stopped on a lucky high. Ship the change, but plan revenue with a smaller number, or keep a holdout to measure the real effect. Result: a forecast that does not rest on the luckiest moment of the test.
Examples
A fintech onboarding test with weekly reviews
Illustrative. A payments app tests a shorter identity check. The fixed-horizon calculation says 30,400 users per variant, about three weeks of traffic. The team reviews results every Monday, so it plans three looks with an O'Brien-Fleming boundary: z above 3.47 after week one, 2.45 after week two, 2.00 at the end. The maximum sample rises to about 30,900 per variant. If the lift is real, the expected sample falls to about 26,000, because in about four runs out of ten it stops at week two.
A clinic booking flow with a guardrail
Illustrative. A dental clinic network tests a new online booking page. Its main metric is completed bookings, and its guardrail is calls to the front desk. The team uses an always-valid confidence sequence on the guardrail so it can stop the moment calls rise, whatever day that happens. The success metric is read once, at the planned end, with an ordinary test.
A Bayesian dashboard read the wrong way
Illustrative. A store's testing tool shows chance to beat control. A marketer checks it daily and ships any variant that passes 95%. In our simulation of identical variants at 5% conversion with 1,000 users per arm a day, this rule picks a false winner in 21% of 20-day tests, against 5% for a single read on day 20. The fix is a minimum sample and a single decision point, or an expected-loss rule with a stated threshold.
When to use it
Use sequential testing when results are checked during the test anyway, when a harmful variant must be stopped fast, or when shipping a real winner a week earlier is worth a slightly larger maximum sample. Use Bayesian reporting when stakeholders need a probability and an expected loss rather than a p-value, and you can set a prior from past experiments.
When not to use it
Skip sequential designs when nobody will look before the end: a fixed-horizon test has the most power for its sample. Skip mSPRT when you know the sample size and review on a schedule, because a group sequential design is more powerful there. Do not use a Bayesian chance to win as a stopping rule if your organization needs a controlled false positive rate.
Common mistakes
- Stopping on the naive p-value. Ten equally spaced looks at the usual 1.96 threshold raise the false positive rate from 5% to about 19%.
- Treating Bayesian results as immune to peeking. The posterior stays a valid summary, but how often you ship a variant that does nothing still rises with every look.
- Running past the planned maximum. A group sequential design spends its alpha by the last look; adding looks afterwards inflates false positives again, as Spotify's comparison notes.
- Reporting an early winner's lift as the forecast. Tests that stop at the second of five O'Brien-Fleming looks overstate the true effect about twofold on average in our simulation.
- Using a flat prior and calling the result Bayesian evidence. With no prior information, chance to win behaves much like one minus a one-sided p-value and carries the same risks.
FAQ
Is Bayesian A/B testing immune to peeking?
No. The posterior probability is correct under your prior at any moment, but Bayesian rules do not promise to control false positives. David Robinson's 2015 simulation found that daily peeking with an expected-loss rule raised wrong switches from 2.5% to 11.8%. Use a minimum sample, a single decision point or a rule proven safe for optional stopping.
What is the mSPRT in A/B testing?
The mixture sequential probability ratio test compares how likely the data are under a range of possible effects against no effect, and stops when that ratio exceeds 1/alpha, such as 20 for 5%. Johari, Pekelis and Walsh turned it into always-valid p-values for Optimizely. Statsig uses it too. You may check after every visitor.
What is the O'Brien-Fleming boundary?
It is a stopping rule for tests with a few planned looks, published by Peter O'Brien and Thomas Fleming in 1979. Early looks need very strong evidence and later ones almost the usual threshold. With five looks at 5% significance the z thresholds are 4.56, 3.23, 2.63, 2.28 and 2.04, and the maximum sample grows by only about 3%.
How many times can I check an A/B test?
With a standard test, once. Each extra look at the 1.96 threshold adds false positives: two looks give about 8%, five about 14%, twenty about 25%. With a group sequential design you can look as many times as you planned, and with always-valid methods as often as you like.
Bayesian or frequentist A/B testing: which is better?
Neither wins everywhere. Frequentist sequential tests guarantee a false positive rate under repeated looks. Bayesian analysis gives probabilities and expected losses that are easier to explain and can use priors from past tests. GrowthBook, for one, offers both. Pick by what you need to promise: an error rate, or a decision that minimizes expected loss.
Sources
- Abraham Wald, Sequential Tests of Statistical Hypotheses, Annals of Mathematical Statistics 16(2), 1945
- P. Armitage, C.K. McPherson, B.C. Rowe, Repeated Significance Tests on Accumulating Data, Journal of the Royal Statistical Society A 132(2), 1969
- Herbert Robbins, Statistical Methods Related to the Law of the Iterated Logarithm, Annals of Mathematical Statistics 41(5), 1970
- Stuart J. Pocock, Group sequential methods in the design and analysis of clinical trials, Biometrika 64(2), 1977
- Peter C. O'Brien, Thomas R. Fleming, A Multiple Testing Procedure for Clinical Trials, Biometrics 35(3), 1979
- K.K. Gordon Lan, David L. DeMets, Discrete sequential boundaries for clinical trials, Biometrika 70(3), 1983
- US Food and Drug Administration, Adaptive Design Clinical Trials for Drugs and Biologics, Guidance for Industry, 2019
- Evan Miller, How Not To Run an A/B Test, 2010
- Evan Miller, Simple Sequential A/B Testing, 2015
- Evan Miller, Formulas for Bayesian A/B Testing
- Ramesh Johari, Leo Pekelis, David J. Walsh, Always Valid Inference: Bringing Sequential Analysis to A/B Testing, arXiv 1512.04922
- Ramesh Johari, Pete Koomen, Leonid Pekelis, David Walsh, Always Valid Inference: Continuous Monitoring of A/B Tests, Operations Research 70(3), 2022
- Ramesh Johari, Pete Koomen, Leonid Pekelis, David Walsh, Peeking at A/B Tests: Why it matters, and what to do about it, KDD 2017
- Steven R. Howard, Aaditya Ramdas, Jon McAuliffe, Jasjeet Sekhon, Time-uniform, nonparametric, nonasymptotic confidence sequences, Annals of Statistics 49(2), 2021
- Mårten Schultzberg, Sebastian Ankargren, Choosing a Sequential Testing Framework: Comparisons and Discussions, Spotify Engineering, 2023
- Statsig documentation, Sequential testing
- GrowthBook documentation, Sequential testing
- GrowthBook documentation, Statistical details of the Bayesian engine
- Optimizely, Stats Engine: How Statistical Decisions Work
- Michael Lindon, Dae Woong Ham, Martin Tingley, Iavor Bojinov, Anytime-Valid Linear Models and Regression Adjusted Causal Inference in Randomized Experiments, arXiv 2210.08589
- Michael Lindon, Alan Malek, Anytime-Valid Inference For Multinomial Count Data, NeurIPS 2022
- David Robinson, Is Bayesian A/B Testing Immune to Peeking? Not Exactly, Variance Explained, 2015
- Chris Stucchio, Easy Evaluation of Decision Rules in Bayesian A/B testing, 2014
- Alex Deng, Jiannan Lu, Shouyuan Chen, Continuous Monitoring of A/B Tests without Pain: Optional Stopping in Bayesian Testing, arXiv 1602.05549
- Jeffrey N. Rouder, Optional stopping: No problem for Bayesians, Psychonomic Bulletin & Review 21(2), 2014
- Rianne de Heide, Peter D. Grünwald, Why optional stopping can be a problem for Bayesians, Psychonomic Bulletin & Review 28(3), 2021
- Ron Kohavi, Alex Deng, Lukas Vermeer, A/B Testing Intuition Busters: Common Misunderstandings in Online Controlled Experiments, KDD 2022
Last updated Oct 9, 2026


Marketing agency or growth system: when a company outgrows its agency
An agency is the right call while the founder still runs most of the company. Once the business starts copying itself into new locations or markets, it needs a system that sets goals, tests hypotheses and owns the result.

Why healthcare marketing agencies stall: the short, mid and long wins model we use with clinics
Most agencies own the click and nobody owns the front desk. How we structure clinic work in three horizons, the research behind each one, and one year of results.

Why channel tests stall after month three
Most paid channel tests do not end with a decision. They end when the budget runs out, the attribution model changes, or everyone quietly stops looking at the dashboard.