TAM SAM SOM
TAM SAM SOM is a way to size a market in three nested layers, from total demand down to the revenue you can realistically win in the next few years.
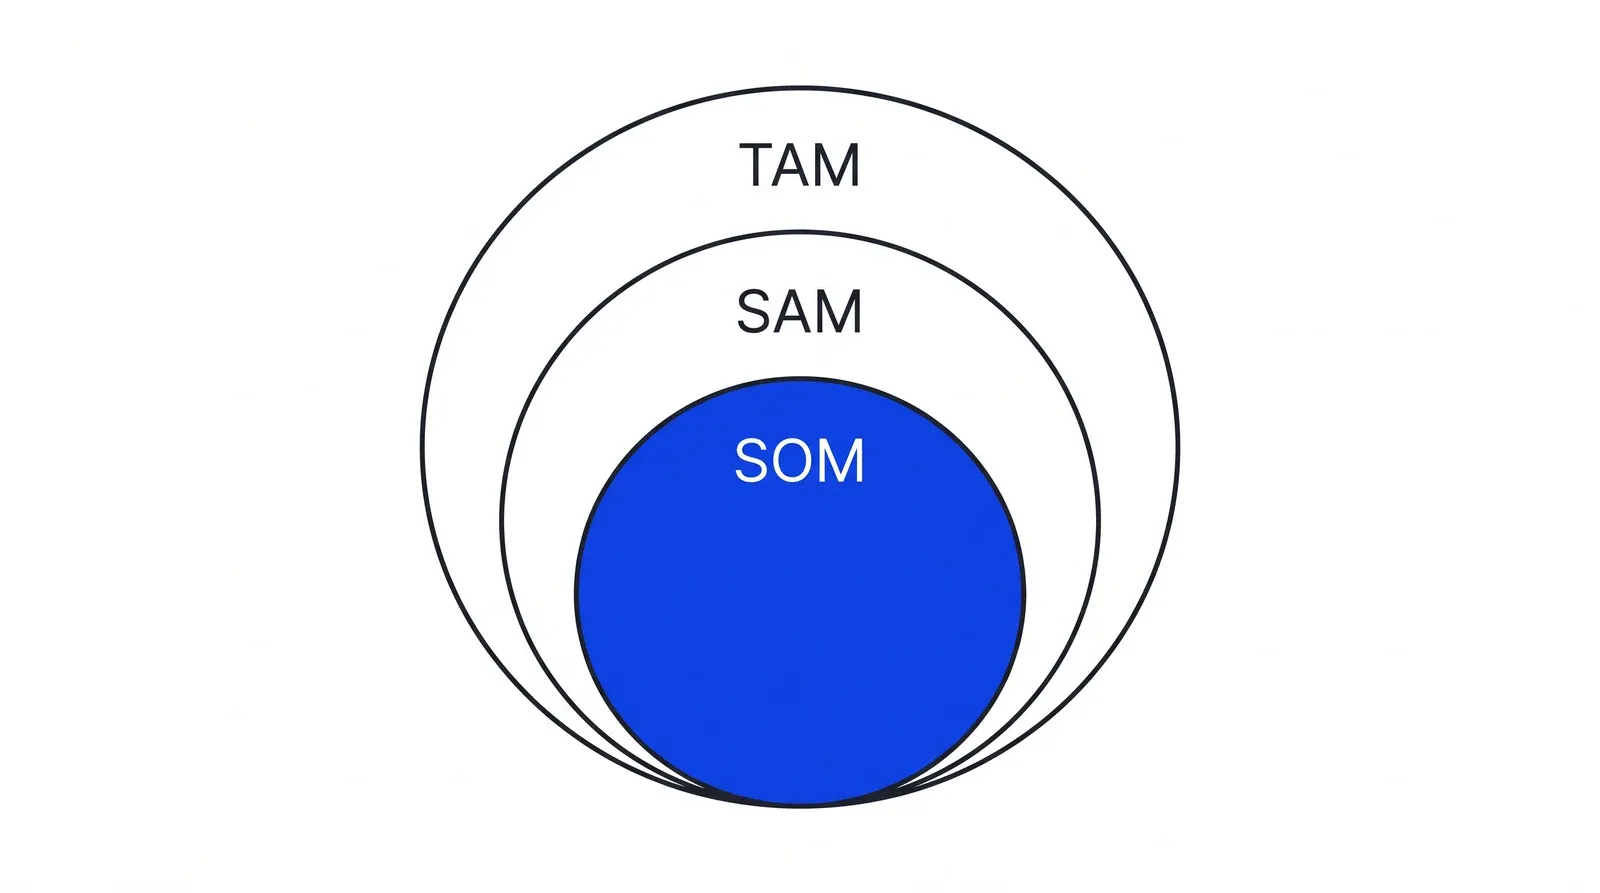
TAM SAM SOM is a market sizing model with three nested numbers. TAM, the total addressable market, is annual revenue at 100% share of everyone who could buy. SAM, the serviceable market, is the part your product, price and geography can reach. SOM, the obtainable market, is the share you can realistically win in one to three years. Founders use it to test whether a market is worth entering.
- Origin
- Venture and technology-industry practice; no single inventor is credited, in common use among investors by the 2000s; the acronyms vary by source
- Level
- 201 · Tool
- Fits
- Startup, Scale-up
- Time to apply
- half a day for a first bottom-up estimate, then a week of customer calls to check the inputs
- What you need
- a written description of the customer who pays, specific enough to count · your price per customer per year, or a realistic estimate of it · one public data source for counting customers, such as a census business count or an industry register · your sales and marketing capacity for the next three years
TAM SAM SOM is a way to size a market in three nested layers. TAM, the total addressable market, is the revenue you would earn with 100% of every customer who could buy. SAM, the serviceable market, is the part your product, price and reach can serve today. SOM, the obtainable market, is the part you can realistically win in the next one to three years.
The model grew out of venture and technology-industry practice, and no source we checked credits an inventor or a first use. That is one reason the acronyms vary. TAM is written as total addressable, total available or total attainable market. SAM is serviceable addressable, serviceable available or served available market. Steve Blank’s startup course, as summarized by the University of Pittsburgh Innovation Institute, calls the third layer the target market. The meaning stays the same.
Investors ask for it because market size is one of the first things they judge. In a survey of venture capitalists by Gompers, Gornall, Kaplan and Strebulaev, 68% named the market as an important factor in choosing deals. The team came first, at 95%.
What each layer means
Each layer is a subset of the one above it, and each step down applies a stated filter.
| Layer | Question it answers | Typical filters |
|---|---|---|
| TAM | How much would all possible customers pay per year? | Who has the problem and could pay |
| SAM | How much of that can our product reach now? | Geography, language, licence, integrations, price |
| SOM | How much can we win in one to three years? | Competition, sales capacity, budget, churn |
Bill Aulet’s Disciplined Entrepreneurship, the method taught at MIT, defines TAM as the annual revenue you would earn at 100% market share. Note the unit. Uber’s and Airbnb’s IPO filings measure the market in gross customer spending, while Aulet counts revenue to the company. Say which one you use, and use the same unit in all three layers.
Top-down or bottom-up?
Bottom-up sizing counts real customers and multiplies by what each pays per year. Top-down sizing starts from an industry total and cuts it with percentages. Use bottom-up as your number and top-down as a check.
| Top-down | Bottom-up | |
|---|---|---|
| Starts from | An industry report or a national statistic | A count of customers matching your definition |
| Formula | Industry total x share of segment x your share | Customers x annual revenue per customer |
| Strength | Fast, uses accepted data | Every input can be checked with customers |
| Weakness | Hides how you will reach anyone | Needs a precise customer definition and real counts |
The a16z article “16 More Startup Metrics” shows the problem with top-down. Multiply 1.36 billion people in China by $1 of toothbrushes a year and a 40% share, and you get about $540 million. Nothing in that calculation says how the toothbrushes reach anyone. A bottom-up count by sales channel forces that question. Aulet calls bottom-up, “counting real customers”, his preferred analysis and warns that top-down tends to be overly optimistic.
A worked bottom-up example
Take a company selling online booking and reminder software to dental clinics. The numbers are illustrative arithmetic, not data about a real market.
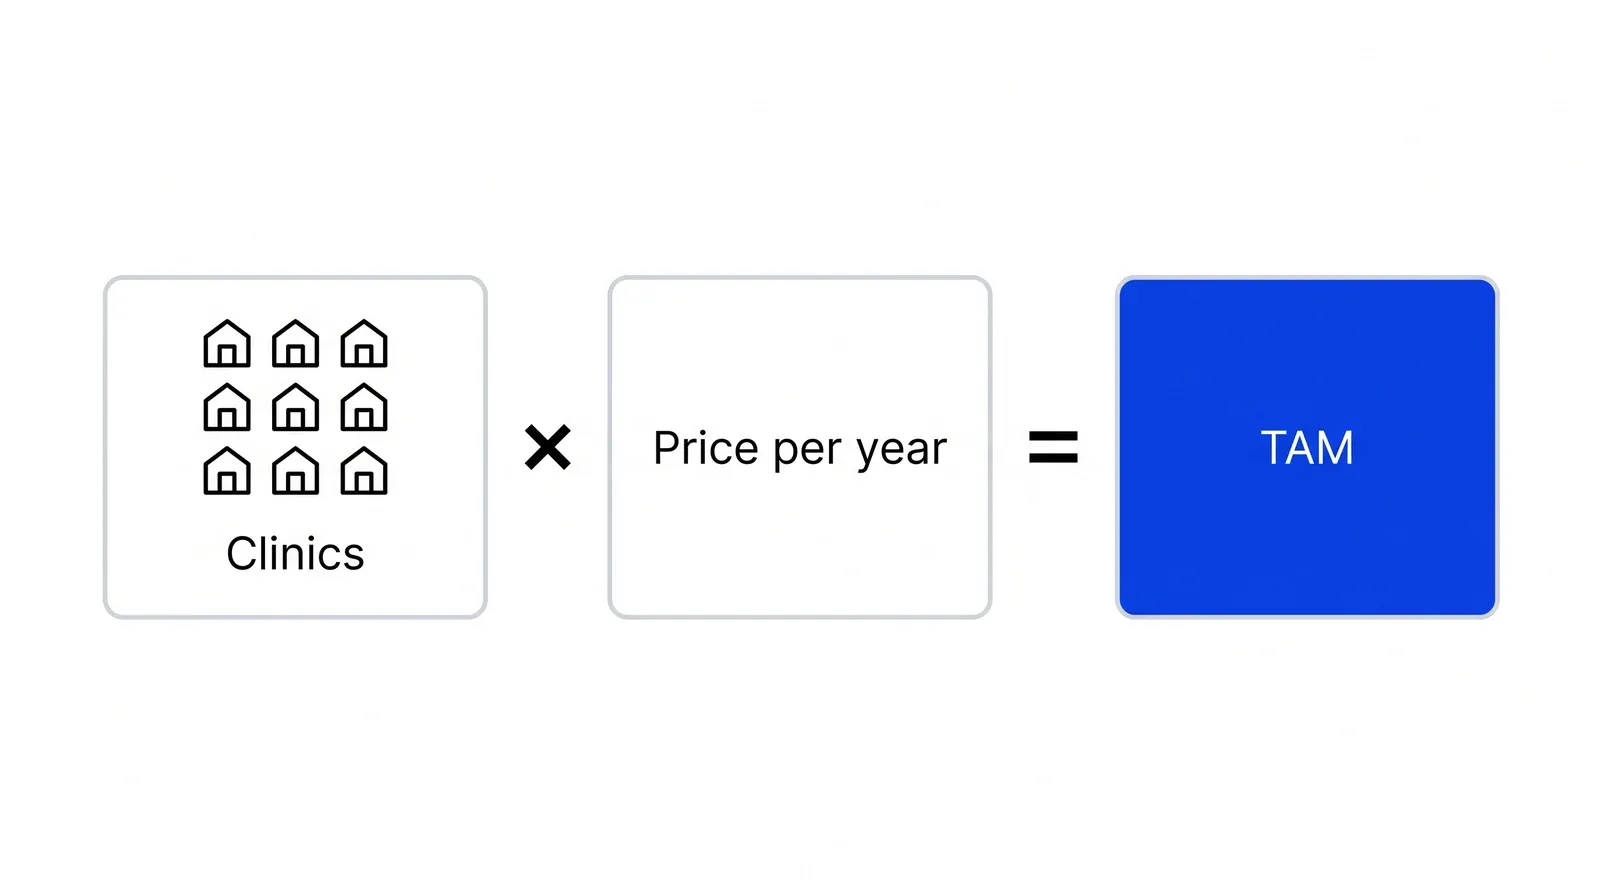
The country has 12,000 dental clinics, a count you could take from a business register such as the US Census Bureau’s County Business Patterns in the United States. The software costs $150 a month, so $1,800 a year.
- TAM: 12,000 clinics x $1,800 = $21.6 million a year.
- SAM: the software integrates with two practice-management systems used by 40% of clinics. 4,800 clinics x $1,800 = $8.64 million.
- SOM: two sales reps each close 8 clinics a month, so 16 a month and 192 a year. Over three years that is 576 clinics. If 76 cancel, 500 remain. 500 x $1,800 = $900,000, about 10% of SAM.
Now cross-check top-down. Suppose an industry report puts dental software in the same country at $40 million. The gap with the $21.6 million bottom-up TAM is a prompt to compare definitions. If the report includes imaging and billing software, the two numbers measure different markets, and your bottom-up figure is the one that describes what you sell.
The example also shows where SAM grows. Each filter, here the missing integrations, is a product decision. Building a third integration might raise SAM more than any marketing campaign.
Why the market definition matters more than the arithmetic
The best-known argument about market size is about definition. In June 2014 the NYU finance professor Aswath Damodaran valued Uber at about $5.9 billion. He assumed a global taxi and limo market of $100 billion and a 10% share, with Uber keeping 20% of fares.
Bill Gurley, an Uber investor and board member, replied that the arithmetic was fine and the market was wrong. Lower prices, shorter waits and new uses, such as replacing a second car, would make the market several times larger than the taxi industry. He put the opportunity at roughly $450 billion to $1.3 trillion. A year later Damodaran wrote that he would remain grateful to Gurley and revalued Uber at about $54 billion on a broader market.
The opposite error is just as common. Cornell and Damodaran’s 2020 paper “The Big Market Delusion” in the Financial Analysts Journal argues that founders and investors in big markets become overconfident together, so the companies in them get overpriced until a correction. Damodaran’s 2019 blog post names the habit of stretching what “accessible” means to make the number bigger.
Sizing a market that does not exist yet
When no report covers your category, top-down has nothing to start from. The Martin Trust Center for MIT Entrepreneurship says you cannot extrapolate from existing data in that case and recommends bottom-up. Another route is an adjacent market. At SuperMac, Steve Blank sized the market for color graphics boards from analyst data on color desktop publishing software, because buyers of one needed the other.
For a new category, treat SOM as a hypothesis. The Rev1 Ventures toolkit says SOM cannot be reliably calculated until prototypes have tested your assumptions with customers. In Pushers’ Growth Lab work, this is where market sizing turns into tests, and a Lean Canvas is a quick way to keep the customer definition and the numbers on one page.
How to apply TAM SAM SOM, step by step
- Define the paying customer. Write one sentence that names who pays, for what, and how often: independent dental clinics paying a monthly subscription, or freelancers paying a fee on each incoming payment. Result: a definition precise enough that two people would count the same customers.
- Count customers and set a price. Count the customers who match the definition, using a public register, census business counts or industry association lists, and multiply by annual revenue per customer. Result: a bottom-up TAM with every input written next to its source.
- Apply the filters that cut the market today. Remove the customers you cannot serve yet: wrong country, wrong language, missing integration, no licence, price above their budget. Result: a SAM, plus a list of the filters, which doubles as a product roadmap for widening it later.
- Build SOM from capacity. Estimate how many customers your team can win per month with its sales headcount and marketing budget, subtract churn, and run it for three years. Result: a SOM in customers and revenue, plus the share of SAM it implies.
- Cross-check top-down. Compare your TAM with an industry report or a filing from a public competitor. A gap of more than about a third means the two numbers define the market differently, so find out which customers or products explain it. Result: a TAM you can defend line by line.
- Write down the assumptions that move the number. List the two or three inputs that change the result most, usually price, customer count and win rate, and plan how to test each one with customers. Result: a short list of tests for the next month.
Examples
Uber's IPO filing
According to Uber's 2019 Form S-1, its Personal Mobility TAM was 11.9 trillion miles a year, an estimated $5.7 trillion across 175 countries, counting every passenger vehicle and public transport mile. According to the same filing, the current SAM kept only passenger vehicle trips under 30 miles in the 57 countries where Uber operated: 3.9 trillion miles, about $2.5 trillion. According to Uber, a near-term SAM of 4.7 trillion miles added six countries where regulation limited growth, and the 26 billion miles on its platform in 2018 meant less than 1% penetration of it. Each step down is a stated filter on trip type and geography.
Airbnb's IPO filing
According to Airbnb's 2020 Form S-1, its SAM was $1.5 trillion, made up of $1.2 trillion for short-term stays and $239 billion for experiences. According to the same filing, its TAM of $3.4 trillion added long-term stays and non-tourist recreation spending. Per Airbnb, long-term stays were left out of SAM to give a more conservative view of the near-term opportunity, even though they were 14% of nights booked in 2019. Both figures were built from 2019 data, partly from Euromonitor estimates.
A payments app for freelancers (illustrative)
Illustrative, no real company implied. A country has 200,000 freelancers paid by foreign clients, each receiving about $30,000 a year. At a 1% fee, each is worth $300 a year, so TAM is 200,000 x $300 = $60 million. The app's licence covers only incoming US dollars and euros, which are 70% of the volume, so SAM is $42 million. Marketing can afford $600,000 a year at $200 per new customer, which brings 3,000 customers a year. After three years and 1,500 churned customers, the app has 7,500 customers paying $300, so SOM is $2.25 million, about 5% of SAM.
When to use it
Use it before entering a market, when writing an investor deck, when choosing between two customer segments, and when setting a three-year revenue target that sales and marketing must hit. It is most useful early, when the question is whether a market can support the business at all.
When not to use it
Skip it when the category does not exist yet and no one can count buyers; there, run customer interviews and small paid tests first. It also adds little for a mature business that already has market share data, where cohort and funnel analysis tell you more about growth.
Common mistakes
- Taking 1% of a giant industry figure and calling it SOM, which hides the hard part: how you reach and win each customer.
- Mixing units, such as a TAM in gross spending and a SOM in your own revenue, so the share of SAM looks smaller or larger than it is.
- Copying an analyst report's market definition without checking that its product categories match what you sell.
- Treating TAM as fixed. A cheaper or more convenient product can grow the market, as the Uber debate between Damodaran and Gurley showed.
- Building SOM from a share assumption with no sales capacity, budget or churn behind it.
FAQ
What is the difference between TAM, SAM and SOM?
TAM is the annual revenue if every possible customer bought from you. SAM is the part of TAM your current product, price, channels and geography can reach. SOM is the part of SAM you expect to win in the next one to three years, given competition and your sales capacity. Each is a subset of the one above it.
What is PAM in PAM TAM SAM SOM?
PAM usually stands for potential available market, a fourth and wider circle around TAM. Jon Peddie Research describes it as largely dependent on the marketer's view of the world, and there is no standard definition. Most investors expect only TAM, SAM and SOM, so if you add PAM, define it on the slide.
Should I use top-down or bottom-up market sizing?
Use bottom-up as the main number and top-down as a check. Bottom-up multiplies a count of real customers by what each pays per year, so every input can be tested. Top-down starts from an industry total and applies percentages. Bill Aulet's Disciplined Entrepreneurship and a16z both prefer bottom-up because top-down tends to overstate.
How do you calculate SOM?
Calculate SOM from capacity: how many customers your sales and marketing can win each month, minus churn, over one to three years, times annual revenue per customer. Then divide by SAM to see the implied share. If that share is far above what established competitors hold, lower the inputs or explain why you will win faster.
How big should TAM be for venture capital?
There is no published threshold that investors agree on. In a survey of venture capitalists by Gompers, Gornall, Kaplan and Strebulaev, 68% named the market as an important factor in choosing deals, against 95% for the team. Andreessen Horowitz warns founders not to game the TAM, since eBay and Airbnb began in markets that looked modest.
Sources
- Bill Gurley, How to Miss By a Mile: An Alternative Look at Uber's Potential Market Size, Above the Crowd, July 2014
- Aswath Damodaran, A Disruptive Cab Ride to Riches: The Uber Payoff, June 2014
- Aswath Damodaran, On the Uber rollercoaster, October 2015
- Bradford Cornell, Aswath Damodaran, The Big Market Delusion: Valuation and Investment Implications, Financial Analysts Journal 76(2), 2020
- Aswath Damodaran, The Market is Huge! Revisiting the Big Market Delusion, December 2019
- Uber Technologies, Form S-1, April 2019, SEC EDGAR
- Airbnb, Form S-1, November 2020, SEC EDGAR
- Anu Hariharan, Frank Chen, Jeff Jordan, 16 More Startup Metrics, Andreessen Horowitz, September 2015
- Bill Aulet, Disciplined Entrepreneurship, Step 4: Calculate the TAM for the beachhead market
- Martin Trust Center for MIT Entrepreneurship, How do I estimate TAM when I am creating a new product category?
- Paul Gompers, Will Gornall, Steven Kaplan, Ilya Strebulaev, How Do Venture Capitalists Make Decisions?, NBER working paper draft
- NBER, How Do Venture Capitalists Make Decisions?, Working Paper 22587
- Sequoia Capital, Writing a Business Plan
- Steve Blank, SuperMac War Story 3: Customer Insight is Everyone's Job, March 2009
- University of Pittsburgh Innovation Institute, How big is the pie?, June 2016
- Rev1 Ventures, Entrepreneur Toolkit: Market
- University of Regina, How to calculate market size
- UC Irvine Libraries, Entrepreneurship research guide: Size and share
- Jon Peddie Research, Robert Dow, The fallacy of TAM, June 2015
- TechTarget, TAM SAM SOM definition
- US Small Business Administration, Market research and competitive analysis
- US Census Bureau, County Business Patterns
- US Census Bureau, Statistics of U.S. Businesses
- US Bureau of Labor Statistics, Consumer Expenditure Surveys
Last updated Oct 9, 2026


Marketing agency or growth system: when a company outgrows its agency
An agency is the right call while the founder still runs most of the company. Once the business starts copying itself into new locations or markets, it needs a system that sets goals, tests hypotheses and owns the result.

Why healthcare marketing agencies stall: the short, mid and long wins model we use with clinics
Most agencies own the click and nobody owns the front desk. How we structure clinic work in three horizons, the research behind each one, and one year of results.

Why channel tests stall after month three
Most paid channel tests do not end with a decision. They end when the budget runs out, the attribution model changes, or everyone quietly stops looking at the dashboard.