Conversion rate optimization (CRO)
Conversion rate optimization is the practice of raising the share of visitors who complete one chosen action by researching why they do not, testing fixes and keeping only what the data supports.
Conversion rate optimization (CRO) is the practice of raising the share of visitors who complete a chosen action, such as a purchase, a booking or a sign-up. It works as a loop: measure the funnel, research why people leave, write a hypothesis, test it and decide. The conversion rate is completed actions divided by visitors.
- Origin
- No single originator; built on web analytics, usability research and online controlled experiments, 2000s onward
- Level
- 201 · Tool
- Fits
- Startup, Small and mid-size, Scale-up
- Time to apply
- 2 to 3 weeks for a first research pass on one funnel, then 4 to 8 weeks per test cycle
- What you need
- one conversion that matters, tracked correctly in your analytics · step-by-step funnel data for the last 4 to 8 weeks · a way to hear customers: surveys, session recordings or five user tests · a developer or tool that can ship a page change to half of your traffic
Conversion rate optimization (CRO) is the practice of raising the share of visitors who complete one chosen action by finding out why the rest do not, testing fixes and keeping the ones that win. The rate is simple arithmetic: completed actions divided by visitors. Google Analytics 4 calls the action a key event, any event that measures something important to the business. What makes CRO a method is the work around that number: evidence first, tests second.
Where does CRO come from?
CRO has no single inventor. It grew out of web analytics, usability research and online controlled experiments. Amy Gallo notes in Harvard Business Review that the A/B method itself is almost 100 years old. Kohavi, Henne and Sommerfield, who ran experiments at Microsoft, described the web version in 2007 and gave it a memorable target: the HiPPO, the highest-paid person’s opinion. Their argument was that teams learn more by testing ideas on customers than by deferring to seniority. At scale the method looks like this: Thomke reports that Booking.com runs about 25,000 tests a year.
The CRO loop
CRO is a loop of five steps: measure, research, form a hypothesis, test and decide, then measure again.
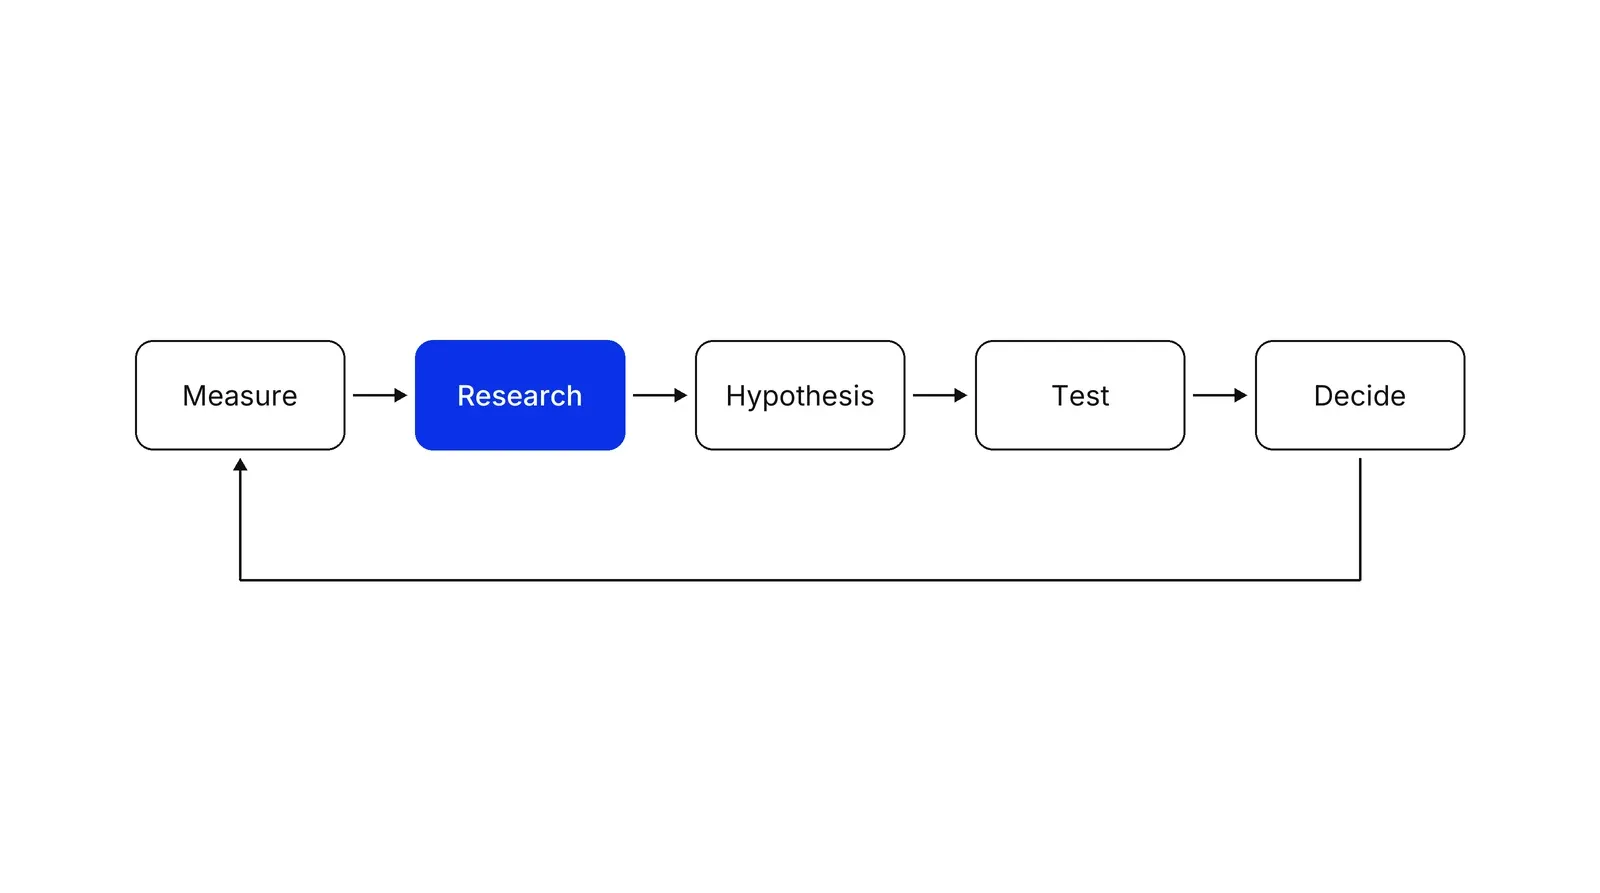
Measure comes first because you cannot optimize a number you cannot trust. Research comes before any idea, because opinions about what to change are the cheapest and least reliable input. Hypothesis forces each idea into a form that can be wrong. Test and decide close the loop with evidence, and the result feeds the next round of measuring.
Where do visitors leave?
Start with the funnel: count how many visitors reach each step, and look for the largest loss.
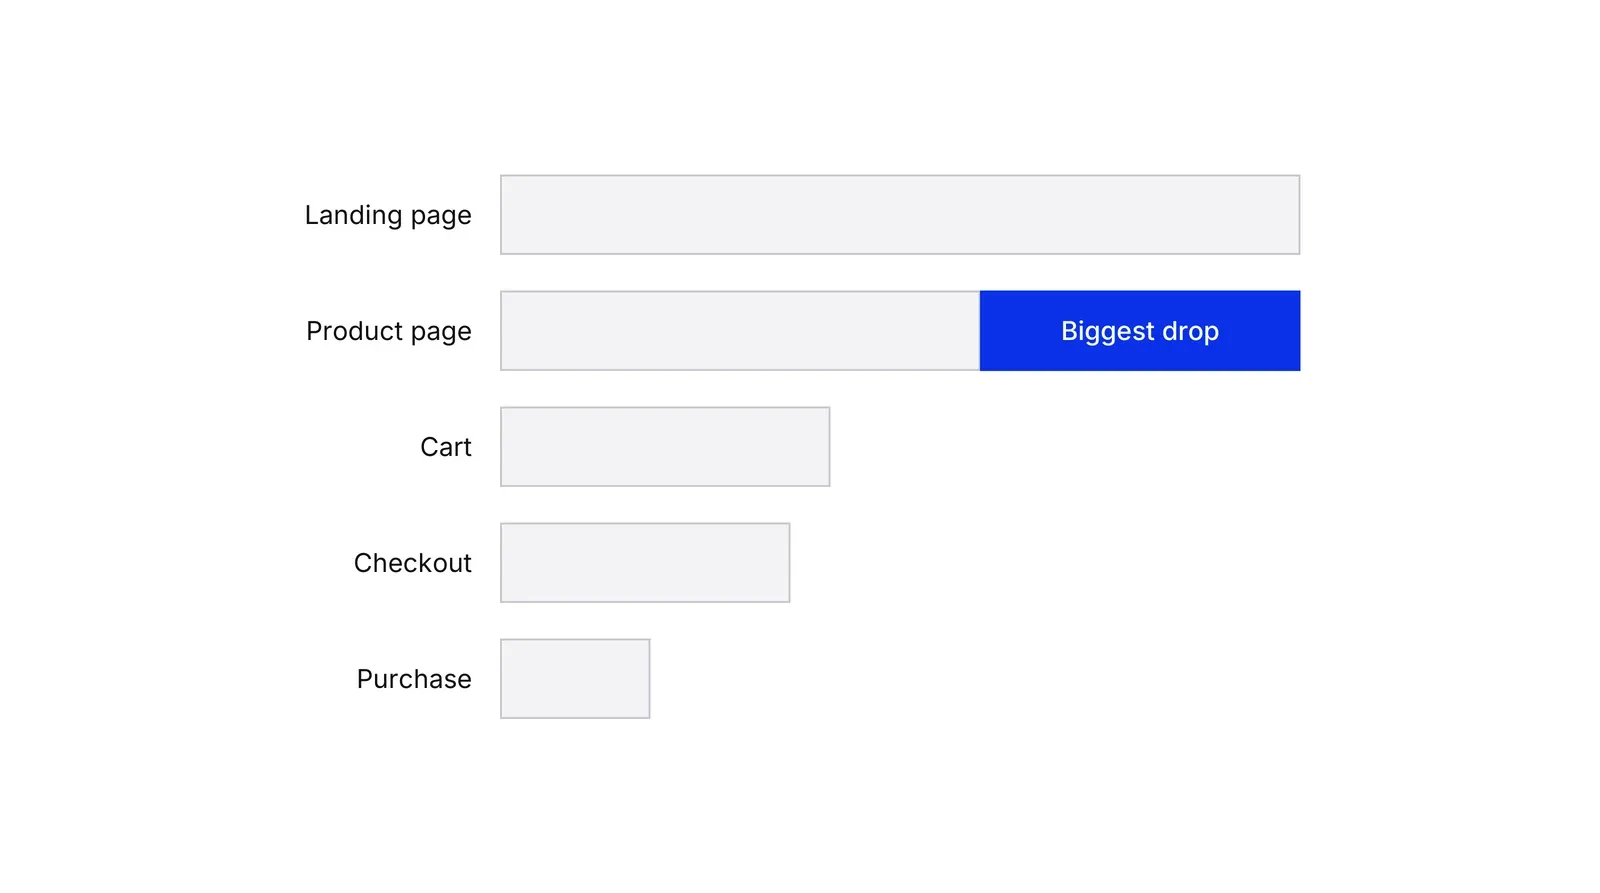
The count tells you where, never why. Our page on funnel analysis covers the arithmetic, including why the biggest percentage drop is not always the step to fix first. Split the numbers by device and traffic source too: a funnel that looks average often hides one segment that converts far worse.
What to research at the leak
Research combines numbers with the words and actions of real people. Speero describes its ResearchXL model as eight steps: a heuristic review, analytics analysis, mouse tracking, on-site polls, customer surveys, user testing, copy testing and a final sorting of findings. Its logic is triangulation: analytics shows what people do, and the qualitative methods suggest why.
| Question | Method | What the evidence says |
|---|---|---|
| Is the page slow or broken? | Core Web Vitals, error logs | Google rates loading good at 2.5 seconds or less. A Deloitte Digital study of 37 brands and over 30 million sessions linked a 0.1 second faster mobile site to 8.4% higher retail conversions and 10.1% higher travel conversions |
| Where is friction in checkout? | Funnel data, session replays | Baymard’s synthesis of 50 studies puts documented cart abandonment at 70.22%; 40% of the shoppers who abandoned a checkout cited extra costs and 17% a complicated checkout |
| Are forms too long? | Field audit | Baymard found the average checkout had 11.3 fields in 2024 and says most sites need 8 |
| What confuses people? | User tests | Nielsen’s model finds about 85% of problems with five users, but Spool’s study, as Hudson reports, found 18 users missed over half of a website’s predicted problems |
The user-test row is a real disagreement, so use five users per round as a fast way to catch obvious problems, not as proof that none remain. To choose the right lever once you see a problem, the Fogg behavior model asks whether the visitor lacks motivation, ability or a prompt, and a friction audit lists the steps that cost effort.
How do you decide what to test?
Rank hypotheses by expected impact, confidence and effort, for example with ICE scoring, and then check whether your traffic can detect the effect at all. Our guide to minimum detectable effect and sample size shows the math; the short version is that small lifts on small traffic cannot be measured.
Expect most tests to lose. Kohavi and Thomke report that at Google and Bing only about 10% to 20% of experiments produce positive results, and at Microsoft about one-third are positive, one-third neutral and one-third negative. A test that loses is not wasted: it removes a wrong belief. Kohavi and colleagues also note that many ideas move key metrics by only around 1%, which is why a sound testing routine matters more than any single idea. For a team running many tests, see experimentation program; for stopping rules and repeated looks, sequential and Bayesian testing.
Which popular claims need care?
Three traps recur.
First, the rate is not the goal. A change that lifts conversions while lowering revenue per visitor is a loss, so pair every primary metric with a guardrail.
Second, manipulation. Mathur and colleagues found 1,818 dark pattern instances across about 11,000 shopping sites, and the FTC’s 2022 staff report catalogues design tricks that push people into choices they would not otherwise make. A conversion won this way tends to return as refunds, complaints and regulatory risk.
Third, folklore. The claim that fewer options always convert better rests on a famous jam study, yet the 2010 meta-analysis by Scheibehenne and colleagues of 50 experiments found a mean effect of virtually zero. A 2015 meta-analysis by Chernev and colleagues found the effect appears when choices are complex, the task is hard or preferences are unclear. Test it on your page instead of assuming it.
If the research shows people understand the page and still do not buy, the problem is the proposition, not the page. That is a job for offer architecture.
CRO compared with its neighbours
| Method | Question it answers | Output |
|---|---|---|
| CRO | How do we get more of our visitors to finish? | A research-led loop of changes |
| A/B testing | Did this change cause a difference? | One validated result |
| Funnel analysis | At which step do we lose people? | A map of leaks |
| Experimentation program | How do many teams test reliably? | Metrics, guardrails, roles |
A Growth Lab plan starts from the funnel and the evidence behind each leak, then sequences tests by what your traffic can answer, as described in our Growth Lab practice.
How to apply Conversion rate optimization (CRO), step by step
- Define the conversion and check the tracking. Pick one action tied to revenue, such as a paid order or a booked appointment, and mark it as a key event in your analytics. Then place a test order yourself and confirm that it is counted once. Result: one conversion definition and numbers you can trust.
- Split the funnel and find the leak. Count visitors at every step from first visit to conversion, and split the counts by device and traffic source. Look for the step where the most visitors leave and for segments that convert far below the rest. Result: a ranked list of leaks with volumes attached.
- Research why people leave. For the top leak, combine what the numbers show with what people say: an on-site poll, a short survey of recent buyers, session recordings and a test with five users. Check page speed and bugs on the devices your visitors use. Result: three to five observed problems, each with evidence.
- Write hypotheses and rank them. Phrase each fix as: because we saw X, changing Y should move metric Z. Score the list with ICE or a similar method and discard ideas your traffic cannot test. Result: a short backlog with one test at the top.
- Run the test, then decide. Fix the sample size and end date before launch, run for full weeks and read the result once. Check a guardrail such as revenue per visitor or refund rate as well as the conversion rate. Result: ship, drop or iterate, written in a test log.
- Feed the result back into the research. Record what the test taught you about the visitor, not only whether it won, and let that change the next round of hypotheses. Result: a growing log in which each test is cheaper to design than the last.
Examples
The Obama campaign splash page, a documented case
[Optimizely reported](https://www.optimizely.com/insights/blog/how-obama-raised-60-million-by-running-a-simple-experiment/) that the campaign tested a splash page with 4 button texts and 6 images or videos, 24 combinations in all, on about [310,000 visitors](https://www.optimizely.com/insights/blog/how-obama-raised-60-million-by-running-a-simple-experiment/). A 'Learn More' button with a family photo lifted the sign-up rate from 8.26% to 11.6%, a 40.6% relative gain. [Optimizely's claim](https://www.optimizely.com/insights/blog/how-obama-raised-60-million-by-running-a-simple-experiment/) of 2.88 million extra sign-ups and $60 million in donations extrapolates from this test, and the source sells testing software, so treat those totals as an estimate.
A clinic booking page
Illustrative. A private clinic's booking page gets a few thousand visitors a month and about 3% of them book. Recordings show many visitors stop at a form asking for an insurance number they do not have to hand. The hypothesis: because people abandon at the insurance field, making it optional should raise bookings. With so little traffic a split test would take months, so the clinic ships the change and compares the next two months with the last two, watching the number of insurance-field errors as a check. Without the research step it would have tested button colours.
A payments app sign-up
Illustrative. A consumer payments app finds that fewer than half of new sign-ups finish identity checks. Funnel data shows most losses on the document-upload screen, and session replays show people retaking photos that fail. The team tests on-screen guidance that explains how to frame the document. The primary metric is checks completed; guardrails are the fraud review rate and support tickets per 1,000 users, so a gain that lets bad documents through does not ship.
When to use it
Use it when a page or funnel already gets steady traffic and you want more orders, bookings or leads from the visitors you pay for. It fits best after the offer is settled, when the question is why people who showed interest do not finish.
When not to use it
Skip it when traffic is so low that no test can answer anything, or when the real problem is upstream: the wrong audience, a weak offer or a product nobody wants. Moving a button will not fix those. For long sales cycles with few conversions a month, use funnel analysis and customer interviews instead.
Common mistakes
- Testing before researching. Teams copy tactics from case studies, and only about one in three ideas at Microsoft, and one in ten to one in five at Google and Bing, beat the control, according to [Kohavi and Thomke](https://hbr.org/2017/09/the-surprising-power-of-online-experiments).
- Chasing the conversion rate alone. A free-shipping banner can raise orders and lower profit per order. Judge every test on a primary metric and at least one guardrail.
- Stopping a test the moment it looks significant. [Johari, Pekelis and Walsh](https://arxiv.org/abs/1512.04922) showed that continuous monitoring breaks standard p-values.
- Using dark patterns. Tricks that push people into choices they did not intend can lift short-term conversion, and the US Federal Trade Commission (FTC) has catalogued them as dark patterns.
- Treating every popular rule as law. 'Fewer options always convert better' comes from a famous jam study, yet two meta-analyses disagree on whether the effect exists.
FAQ
How do you calculate conversion rate?
Divide the number of visitors who completed the action by the number of visitors who could have, then multiply by 100. If 90 of 3,000 visitors book, the rate is 3%. Decide first who counts as a visitor (sessions, users or visitors to one page), because the denominator changes the answer.
What is a good conversion rate?
There is no universal figure. Rates depend on price, traffic source, device and what counts as a conversion, so a number from another industry says little about your site. Compare against your own baseline, split by traffic source and device, and judge a change by the lift it produces.
How much traffic do you need for CRO testing?
It depends on the baseline and the lift you want to detect. A rule of thumb needs about 16σ²/δ² users per variant: with a 5% baseline and a 10% relative lift that is roughly 30,400 users per variant. With less traffic, test larger changes or use qualitative research.
Is CRO the same as A/B testing?
No. A/B testing is one tool inside CRO, used at the test step. CRO also covers measuring the funnel, researching causes with analytics, surveys and user tests, and prioritizing ideas. Some CRO work ships without a test, for example fixing a broken form or a slow page.
What does 'optimization of conversions' mean in Yandex Direct?
It is an ad-bidding setting, not site CRO. In Yandex Direct you choose Metrica goals as conversions, and the system tunes bids toward visitors likely to complete them. It changes who clicks your ad, while CRO changes what happens after the click. The two work best together.
Sources
- Ron Kohavi, Stefan Thomke, The Surprising Power of Online Experiments, Harvard Business Review, September-October 2017
- Ron Kohavi, Diane Tang, Ya Xu, Trustworthy Online Controlled Experiments, Cambridge University Press, 2020
- Ron Kohavi, Randal M. Henne, Dan Sommerfield, Practical Guide to Controlled Experiments on the Web, KDD 2007
- Ron Kohavi, Alex Deng, Brian Frasca, Toby Walker, Ya Xu, Nils Pohlmann, Online Controlled Experiments at Large Scale, KDD 2013
- Amy Gallo, A Refresher on A/B Testing, Harvard Business Review, 2017
- Stefan Thomke, Building a Culture of Experimentation, Harvard Business Review, March-April 2020
- Raphael Lopez Kaufman, Jegar Pitchforth, Lukas Vermeer, Democratizing online controlled experiments at Booking.com, 2017
- Ramesh Johari, Leo Pekelis, David J. Walsh, Always Valid Inference: Bringing Sequential Analysis to A/B Testing
- Optimizely, the Obama campaign splash page experiment
- Speero, How to create winning tests using the ResearchXL model
- Google, About key events, Analytics Help
- Baymard Institute, Cart Abandonment Rate Statistics
- Baymard Institute, Checkout flow: average form fields
- Deloitte Digital and Google, Milliseconds Make Millions, web.dev case study
- Google, Web Vitals, web.dev
- Jakob Nielsen, Why You Only Need to Test with 5 Users, Nielsen Norman Group
- William Hudson, How many users?, Syntagm (on Spool's critique of the five-user rule)
- B.J. Fogg, Fogg Behavior Model, Stanford Behavior Design Lab
- Benjamin Scheibehenne, Rainer Greifeneder, Peter M. Todd, Can there ever be too many options? A meta-analytic review of choice overload, Journal of Consumer Research, 2010
- Alexander Chernev, Ulf Bockenholt, Joseph Goodman, Choice overload: a conceptual review and meta-analysis, Journal of Consumer Psychology, 2015
- US Federal Trade Commission, Bringing Dark Patterns to Light, staff report, September 2022
- Arunesh Mathur and colleagues, Dark Patterns at Scale: Findings from a Crawl of 11K Shopping Websites, CSCW 2019
- Yandex, Conversions and strategies, Yandex Direct help
Last updated Oct 9, 2026


Marketing agency or growth system: when a company outgrows its agency
An agency is the right call while the founder still runs most of the company. Once the business starts copying itself into new locations or markets, it needs a system that sets goals, tests hypotheses and owns the result.

Why healthcare marketing agencies stall: the short, mid and long wins model we use with clinics
Most agencies own the click and nobody owns the front desk. How we structure clinic work in three horizons, the research behind each one, and one year of results.

Why channel tests stall after month three
Most paid channel tests do not end with a decision. They end when the budget runs out, the attribution model changes, or everyone quietly stops looking at the dashboard.