Product-market fit
Product-market fit is the point where a product satisfies a real market well enough that customers keep using it and pull it forward, and the Sean Ellis 40% test and retention curves are the two common ways to check it.
Product-market fit is being in a good market with a product that can satisfy that market, in Marc Andreessen's 2007 wording. Teams check it two ways: a survey test where, according to Sean Ellis, at least 40% of active users should say they would be very disappointed to lose the product, and cohort retention curves that stop falling and flatten above zero.
- Origin
- Andy Rachleff (term); Marc Andreessen (2007 essay); Sean Ellis (40% test), 2007; test around 2009
- Level
- 201 · Tool
- Fits
- Startup
- Time to apply
- two weeks for a first survey and cohort chart, then a monthly or quarterly re-check
- What you need
- at least 40 survey answers from people who have used the product recently · signup dates and activity data to build monthly cohorts · a founder who will read every answer from the very disappointed group
Product-market fit is the stage at which a product satisfies a real market well enough that customers keep using it, tell others about it and would miss it if it disappeared. Marc Andreessen put it in one line in his 2007 essay The only thing that matters: “being in a good market with a product that can satisfy that market.” Founders, early product teams and venture investors use the idea to decide when a startup should stop searching and start scaling.
Most teams check for it with two tools: a survey created by growth marketer Sean Ellis and the shape of cohort retention curves. Superhuman later turned the survey into an operating metric that the whole product team worked toward.
Where the idea came from
The term is credited to Andy Rachleff, co-founder of Benchmark Capital. Unusual Ventures and a16z both say he coined it, and Andreessen’s essay credits him for “Rachleff’s Law of Startup Success”: a great market beats a weak team. Andreessen made the phrase famous by splitting a startup’s life into before and after fit, and by describing how each feels. Before fit, word of mouth is not spreading and sales cycles drag. After fit, customers buy as fast as you can make the product.
Rachleff’s own test is blunter. He asks what you uniquely offer that people desperately want, and for consumer products he looks for exponential organic growth in retained users, not paid growth. “The only way to generate organic growth is through word of mouth,” he told Unusual Ventures.
How the 40% test works
The Sean Ellis test is a single survey question: how would you feel if you could no longer use this product? Answers are very disappointed, somewhat disappointed or not disappointed. Ellis set out the bar in his Startup Pyramid post, written a couple of years after Andreessen’s essay. According to Ellis, fit requires at least 40% of users answering very disappointed.
He was candid about where the number came from. He called the threshold “a bit arbitrary” and said he set it after comparing results across nearly 100 startups: those struggling for traction were always under 40%, and most that gained strong traction were above it. We found no peer-reviewed study that validates the 40% line, so treat it as a practitioner benchmark.
Ellis also gave advice that still holds. Before fit, keep burn low and do not hire VPs of marketing and sales to fix the problem. The founders should talk to users until the product is a must-have.
How Superhuman turned the score into an engine
Rahul Vohra, founder of the email client Superhuman, described the most detailed public use of the test in First Round Review. He added three questions to Ellis’s one: who would benefit most, what is the main benefit, and how could we improve. He notes that about 40 answers give a directional read.
His first score, in summer 2017, was 22%. He then did two things.
- Segment. He filtered to the very disappointed users, identified their roles, and recalculated for the best-fit personas. The score rose to 33% without changing the product.
- Build. He split the roadmap roughly in half: one half doubled down on what fans loved, mainly speed; the other fixed what held back somewhat disappointed users who valued the same benefit, starting with the missing mobile app.
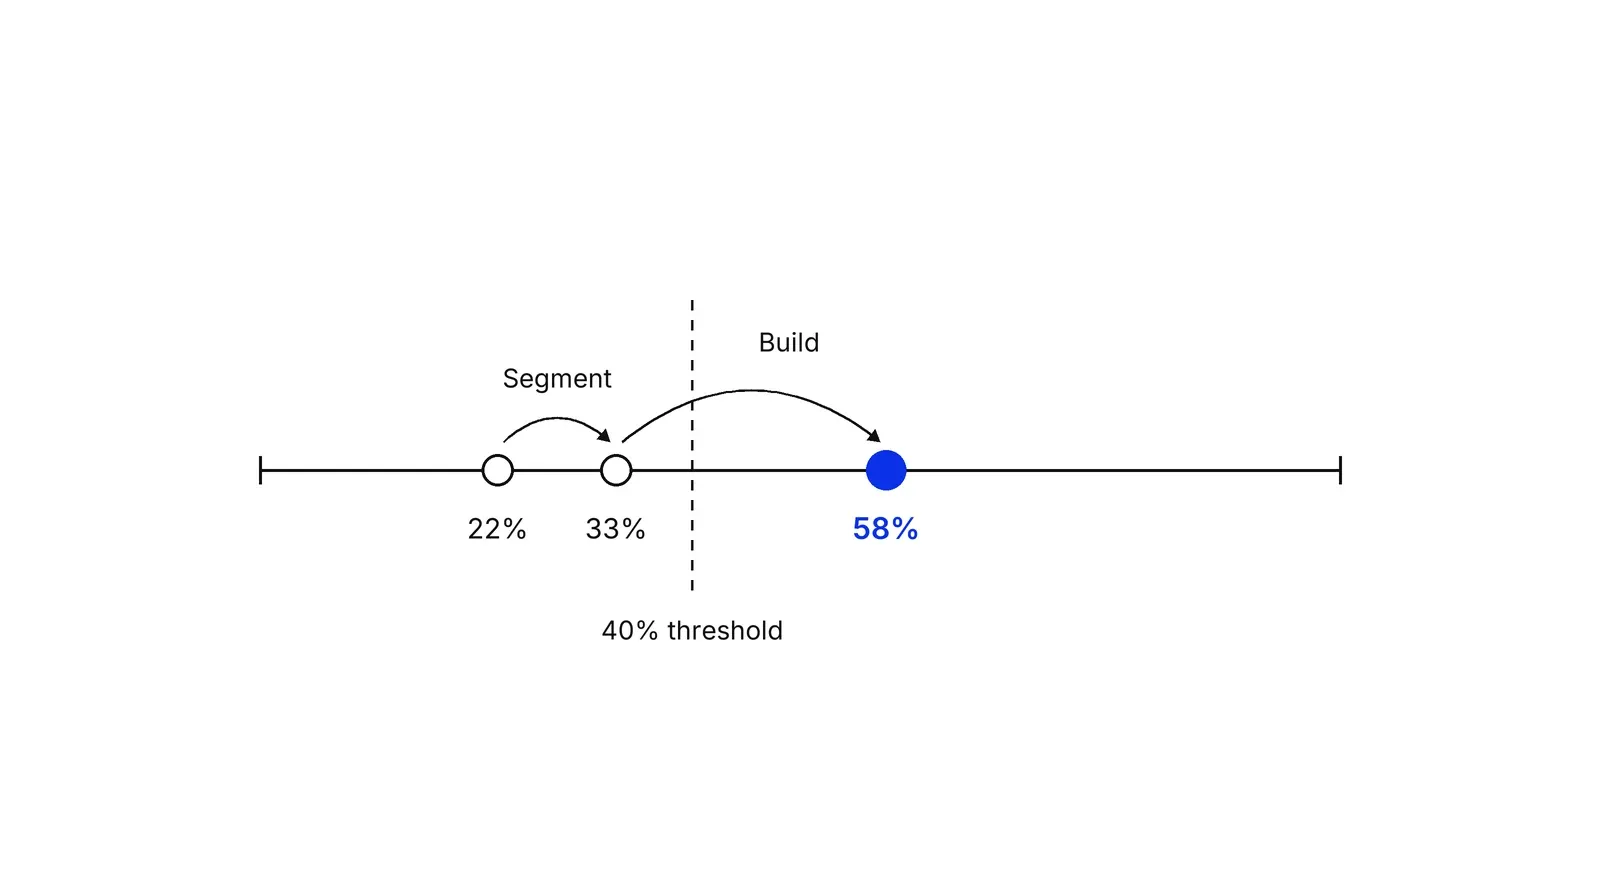
Within three quarters the score reached 58%, and the very disappointed share became the product team’s only key result. Vohra adds a warning: the number can fall as a product moves past early adopters, who forgive more.
Why retention curves are the harder evidence
A retention curve shows, for a group of users who signed up in the same period, what share is still active in each period after. Every curve drops at first. What separates fit from no fit is whether it stops falling. Brian Balfour, quoted by Lenny Rachitsky, put it simply: “If it flattens off at some point, you have probably found product/market fit.”
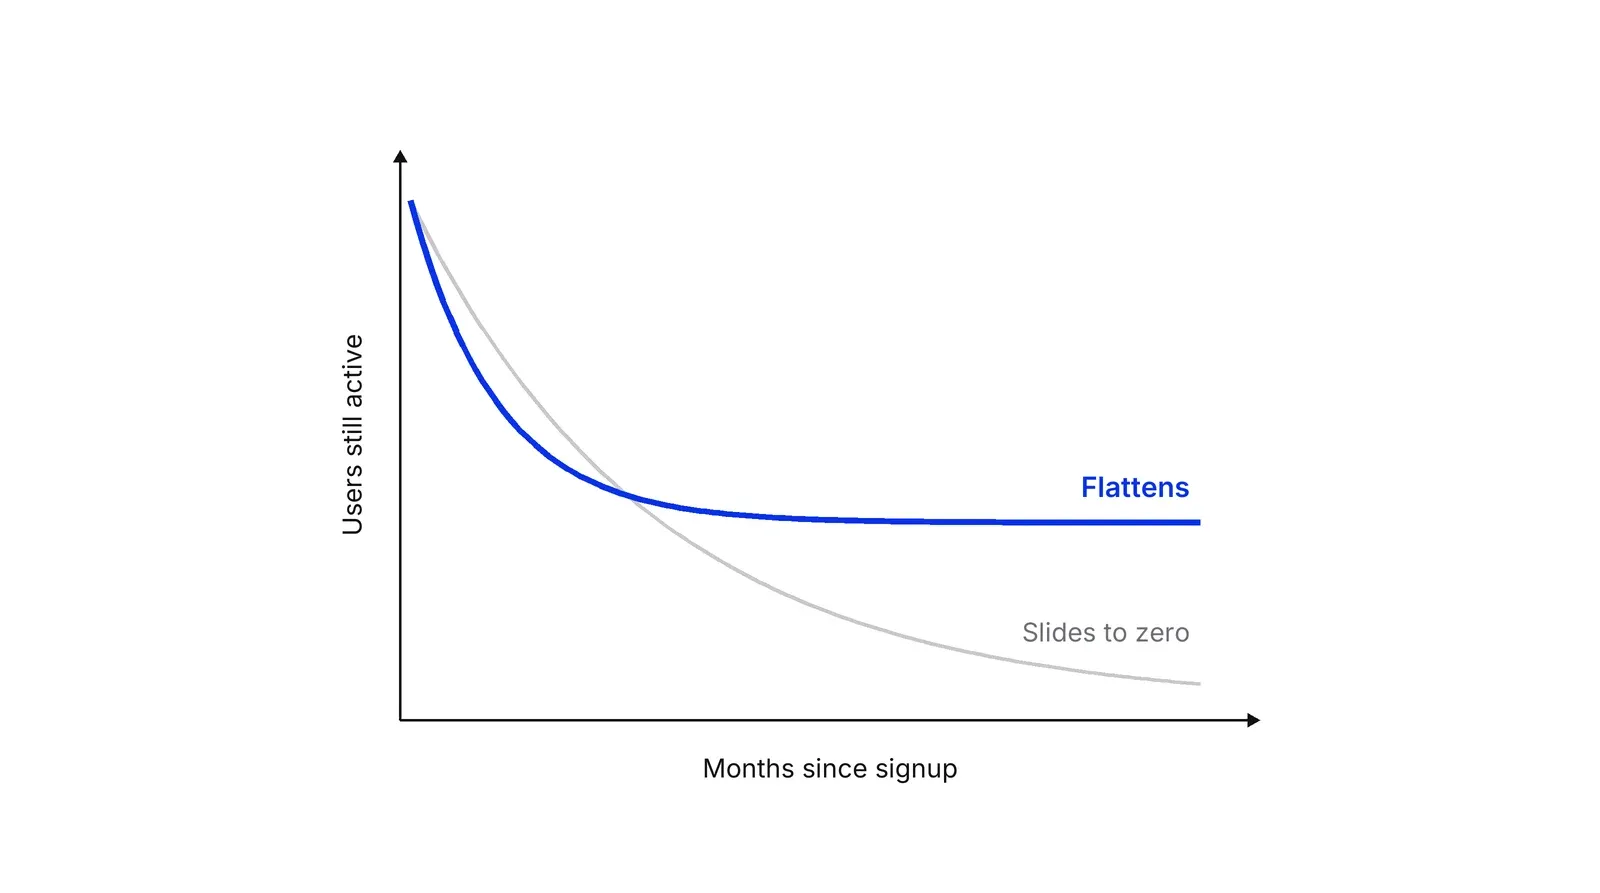
How steep the early drop can be surprises most founders. Data from Quettra published by Andrew Chen showed the average Android app lost 77% of its daily active users within three days of install and 90% within 30 days.
Where the curve should flatten depends on the category. Rachitsky and Casey Winters collected six-month benchmarks from about 20 growth practitioners in What is good retention?:
| Category | Good at 6 months | Great at 6 months |
|---|---|---|
| Consumer social | ~25% | ~45% |
| Consumer transactional | ~30% | ~50% |
| Consumer SaaS | ~40% | ~70% |
| SMB and mid-market SaaS | ~60% | ~80% |
| Enterprise SaaS | ~70% | ~90% |
Winters adds a second condition in Product-Market Fit Requires Arbitrage: the business must be able to win users for less than they are worth, ideally organically. If growth depends on paid ads, he argues, fit is not there yet.
Survey, retention or growth: which signal to trust
Each signal answers a different question, and each can mislead on its own.
| Signal | What it tells you | When it misleads |
|---|---|---|
| Ellis survey (40%) | Whether a core group would miss the product | Small samples, surveying lapsed users, forgiving early adopters |
| Cohort retention | Whether usage lasts | Products used rarely by nature, too few cohorts yet |
| Organic growth | Whether users bring in other users | Short spikes from press or launches |
| Sales yield above one | Whether a sales team, not the founder, can sell profitably | Very early B2B with few deals |
Sales yield, a term from Veritas co-founder Mark Leslie, is annual net revenue divided by the fully loaded cost of the sales team; Rachleff uses a yield above one as the enterprise test. Sequoia’s Arc framework adds that the path to fit differs by problem type, from urgent hair-on-fire problems to ones customers have accepted as facts of life.
What the research says
Academic work on product-market fit is thinner than the practitioner writing. A 2016 conference paper by Dennehy and colleagues reviews PMF frameworks, and Contigiani and Levinthal noted in Industrial and Corporate Change that the lean start-up conversation has been largely decoupled from management research.
The evidence that exists supports testing before scaling. Giardino and colleagues found in a 2014 multiple-case study that failed software startups rushed to launch “to verify product/market fit” and skipped learning whether they had the right problem. A randomized trial of 116 Italian startups by Camuffo and colleagues found founders taught to test hypotheses like scientists performed better and pivoted more often. Koning, Hasan and Chatterji found start-ups that adopted A/B testing improved performance by 30% to 100% after a year.
The cost of skipping the step is also documented, though less rigorously. The Startup Genome report, as summarised by Steve Blank in 2011, said 74% of high-growth internet startups failed because they scaled prematurely.
Before fit and after fit
Before fit, the job is learning: customer interviews that avoid leading questions, small experiments and cheap pivots. After fit, the job changes to building a repeatable growth model, which is where pirate metrics and channel work come in. In Pushers’ Growth Lab work, the survey score and the cohort curve come before any paid acquisition plan, because spend multiplies whatever retention a product already has.
How to apply Product-market fit, step by step
- Write down who the product is for and what it promises. Name the segment and the one main benefit you think they get. A vague answer here makes every later number hard to read. Result: one sentence of the form 'for [segment], [product] gives [benefit]'.
- Run the Ellis survey on active users. Ask how they would feel if they could no longer use the product: very disappointed, somewhat disappointed or not disappointed. Add Superhuman's three follow-ups: who would benefit most, the main benefit, and what to improve. Result: the share of very disappointed users, from at least 40 answers.
- Segment the very disappointed. Sort respondents by role, company type or use case and recompute the score for each group. The group with the highest score is your real market for now. Result: a named segment whose score is higher than the average.
- Plot cohort retention. Group users by the month they signed up and chart the share still active in each month after. Look for the point where the curve stops falling. Result: a chart that shows whether, and at what level, each cohort flattens.
- Split the roadmap between fans and the nearly convinced. Spend about half the work on what very disappointed users love and half on what blocks the somewhat disappointed users who value the same main benefit. Ignore the not disappointed group. Result: a ranked list of projects tied to survey answers.
- Re-measure on a fixed rhythm. Survey new users and redraw cohorts every month or quarter, and keep growth spending low until both signals pass. Result: a trend line for the score and for retention that tells you when to start scaling.
Examples
Superhuman's PMF engine
Rahul Vohra, founder of the email client Superhuman, told First Round Review that his first survey in summer 2017 showed 22% very disappointed. Narrowing to the personas who loved the product most (founders, managers, executives, business development) lifted the score to 33%. The team then split its roadmap between doubling down on speed and fixing blockers such as the missing mobile app, and reached 58% within three quarters. The very disappointed share became the product team's only key result.
An expense card for freelancers
Illustrative, no real company implied. A fintech startup surveys 120 active users of its expense card and gets 31 very disappointed answers, about 26%. Split by customer type, design and video freelancers who invoice clients in other currencies score 46%, while salaried side-hustlers score 12%. The team stops paid acquisition for the second group, rewrites onboarding around multi-currency invoicing, and re-runs the survey a quarter later on new users from the first group.
A booking tool for dental clinics
Illustrative, no real company implied. A SaaS company selling online booking to dental clinics charts monthly cohorts of clinics. Early cohorts slide from 100% to 35% active by month six and keep falling. Cohorts signed after the team added automatic reminder texts drop to 62% by month four and then hold at about 60%. The flattening, not the survey score, is what convinces the founders to hire their first salesperson.
When to use it
Use it before raising a growth round, before hiring sales and marketing leaders, and whenever a startup is debating whether to spend on acquisition. It also helps a team that has several customer types and needs to decide which one to build for.
When not to use it
Skip the survey when you have fewer than about 40 recent users; the answers will be noise. It is also a weak test for products used once a year or bought by committee, where a cohort chart or a sales yield above one says more than a survey of end users.
Common mistakes
- Surveying everyone who ever signed up, including people who tried the product once, which drags the score down and hides the segment that loves it.
- Treating 40% as a law. Sean Ellis called the threshold a bit arbitrary, and benchmarks for retention differ widely by category.
- Reading a falling retention curve as fit because the first-month number looks good. Fit shows up when the curve stops falling.
- Buying growth before fit. Paid acquisition can hide weak retention for months, which is why Andy Rachleff looks for organic growth in retained users.
- Assuming fit is permanent. Vohra warns the score can drop as a product moves past forgiving early adopters.
FAQ
What is product-market fit in simple terms?
It means a product solves a problem for a specific group of customers well enough that they keep using it, recommend it and would miss it if it went away. According to Marc Andreessen's 2007 essay, it is being in a good market with a product that can satisfy that market.
Is it product-market fit or product marketing fit?
The correct term is product-market fit, often written product/market fit. It describes how well a product matches a market, not how well it is marketed. Product marketing is a separate job: positioning, messaging and launches. Good marketing cannot create fit, though it can hide its absence for a while.
What is the Sean Ellis 40% test?
It is a one-question survey: how would you feel if you could no longer use this product? According to Sean Ellis, startups where at least 40% of users said very disappointed usually gained strong traction, while those under 40% struggled. He based the line on nearly 100 startups and called it a bit arbitrary.
How do you measure product-market fit?
Use more than one signal. The Ellis survey gives an early read, cohort retention curves show whether a group of users stays, and organic growth or a sales yield above one shows whether the business can grow on that retention. A flattening curve is usually the hardest evidence to fake.
Who coined the term product-market fit?
Andy Rachleff, co-founder of Benchmark Capital, is credited with naming it, according to Unusual Ventures and a16z. Marc Andreessen made it widely known in his 2007 essay The only thing that matters, where he credits Rachleff for the idea that the market matters most.
Sources
- Marc Andreessen, Part 4: The only thing that matters, pmarchive, 25 June 2007
- Sean Ellis, The Startup Pyramid, Startup Marketing blog (Internet Archive copy, 2011)
- First Round Review, How Superhuman Built an Engine to Find Product/Market Fit (Rahul Vohra)
- Unusual Ventures, How to find product market fit: the counterintuitive secrets (interview with Andy Rachleff), June 2023
- Tren Griffin, 12 things about product-market fit, a16z, February 2017
- Lenny Rachitsky, How to know if you've got product-market fit, Lenny's Newsletter, January 2020
- Lenny Rachitsky and Casey Winters, What is good retention?, Lenny's Newsletter, June 2020
- Casey Winters, Product-Market Fit Requires Arbitrage, January 2016
- Andrew Chen, New data on mobile app retention, with Quettra data from 2015
- Brian Balfour, Four Fits growth framework
- Sequoia Capital, The Arc product-market fit framework
- Paul Graham, Startup = Growth, September 2012
- Steve Blank, What's a startup? First principles, January 2010
- Steve Blank, It's not how big it is, it's how well it performs: the Startup Genome Compass, August 2011
- The Lean Startup, Principles (Eric Ries)
- Carmine Giardino, Xiaofeng Wang, Pekka Abrahamsson, Why Early-Stage Software Startups Fail: A Behavioral Framework, ICSOB 2014
- Arnaldo Camuffo, Alessandro Cordova, Alfonso Gambardella, Chiara Spina, A Scientific Approach to Entrepreneurial Decision Making: Evidence from a Randomized Control Trial, Management Science 66(2), 2020
- Rembrand Koning, Sharique Hasan, Aaron Chatterji, Experimentation and Start-up Performance: Evidence from A/B Testing, Management Science 68(9), 2022
- Andrea Contigiani, Daniel Levinthal, Situating the construct of lean start-up, Industrial and Corporate Change 28(3), 2019
- Rory McDonald, Cheng Gao, Pivoting Isn't Enough? Managing Strategic Reorientation in New Ventures, Organization Science 30(6), 2019
- Denis Dennehy and others, Product Market Fit Frameworks for Lean Product Development, R&D Management Conference 2016, University of Galway record
Last updated Oct 9, 2026


Marketing agency or growth system: when a company outgrows its agency
An agency is the right call while the founder still runs most of the company. Once the business starts copying itself into new locations or markets, it needs a system that sets goals, tests hypotheses and owns the result.

Why healthcare marketing agencies stall: the short, mid and long wins model we use with clinics
Most agencies own the click and nobody owns the front desk. How we structure clinic work in three horizons, the research behind each one, and one year of results.

Why channel tests stall after month three
Most paid channel tests do not end with a decision. They end when the budget runs out, the attribution model changes, or everyone quietly stops looking at the dashboard.