Kano model
The Kano model sorts features by how they change customer satisfaction, so a team knows which ones it must get right, which ones pay back in proportion and which ones can set it apart.
The Kano model is a method for sorting product or service features by how they affect customer satisfaction. Set out in a 1984 paper by Noriaki Kano and three colleagues, it separates must-be features that only prevent dissatisfaction, one-dimensional features that satisfy in proportion to performance, and attractive features that delight when present but are not missed when absent. It also flags indifferent and reverse features.
- Origin
- Noriaki Kano, Nobuhiko Seraku, Fumio Takahashi, Shin-ichi Tsuji, 1984 (first presented in 1982)
- Level
- 301 · Advanced
- Fits
- Startup, Small and mid-size, Scale-up
- Time to apply
- two to three weeks: a few days to write the survey, one to two weeks of answers, a day to analyse
- What you need
- a list of 10 to 25 candidate features or service attributes, written in the customer's words · access to customers in one clearly defined segment, ideally a few dozen or more per segment · a spreadsheet with the 5x5 evaluation table built in · one person who owns the roadmap and will act on the result
The Kano model is a method for sorting the features of a product or service by the way they change customer satisfaction. It tells a team which features customers simply expect, which ones they reward in proportion to how well they work, and which ones surprise them. Noriaki Kano and three colleagues, Nobuhiko Seraku, Fumio Takahashi and Shin-ichi Tsuji, published it in April 1984 in the journal of the Japanese Society for Quality Control under the title Attractive Quality and Must-Be Quality. The paper tested the idea with consumer surveys on television sets and table clocks.
The work did not start in 1984. A 1993 issue of the Center for Quality of Management Journal traces it to a 1979 talk by Kano and Takahashi on motivator and hygiene factors in quality, and to a 1982 presentation at the society’s annual meeting. The motivator and hygiene language comes from Frederick Herzberg, whose research on what motivates employees found that the things that satisfy people at work are not simply the opposite of the things that annoy them. Kano, who taught at Tokyo University of Science from 1982 to 2006 and received the Deming Prize for Individuals in 1997 according to his own profile, applied the same split to products.
Why satisfaction is not one straight line
The Kano model starts from one claim: doing more of something does not always make customers happier in proportion. Before Kano, quality was usually treated as one scale, where a better product meant a more satisfied customer. Kano’s team argued that quality has two dimensions, how well a feature is fulfilled and how the customer feels about it, and that the relationship between the two takes different shapes.
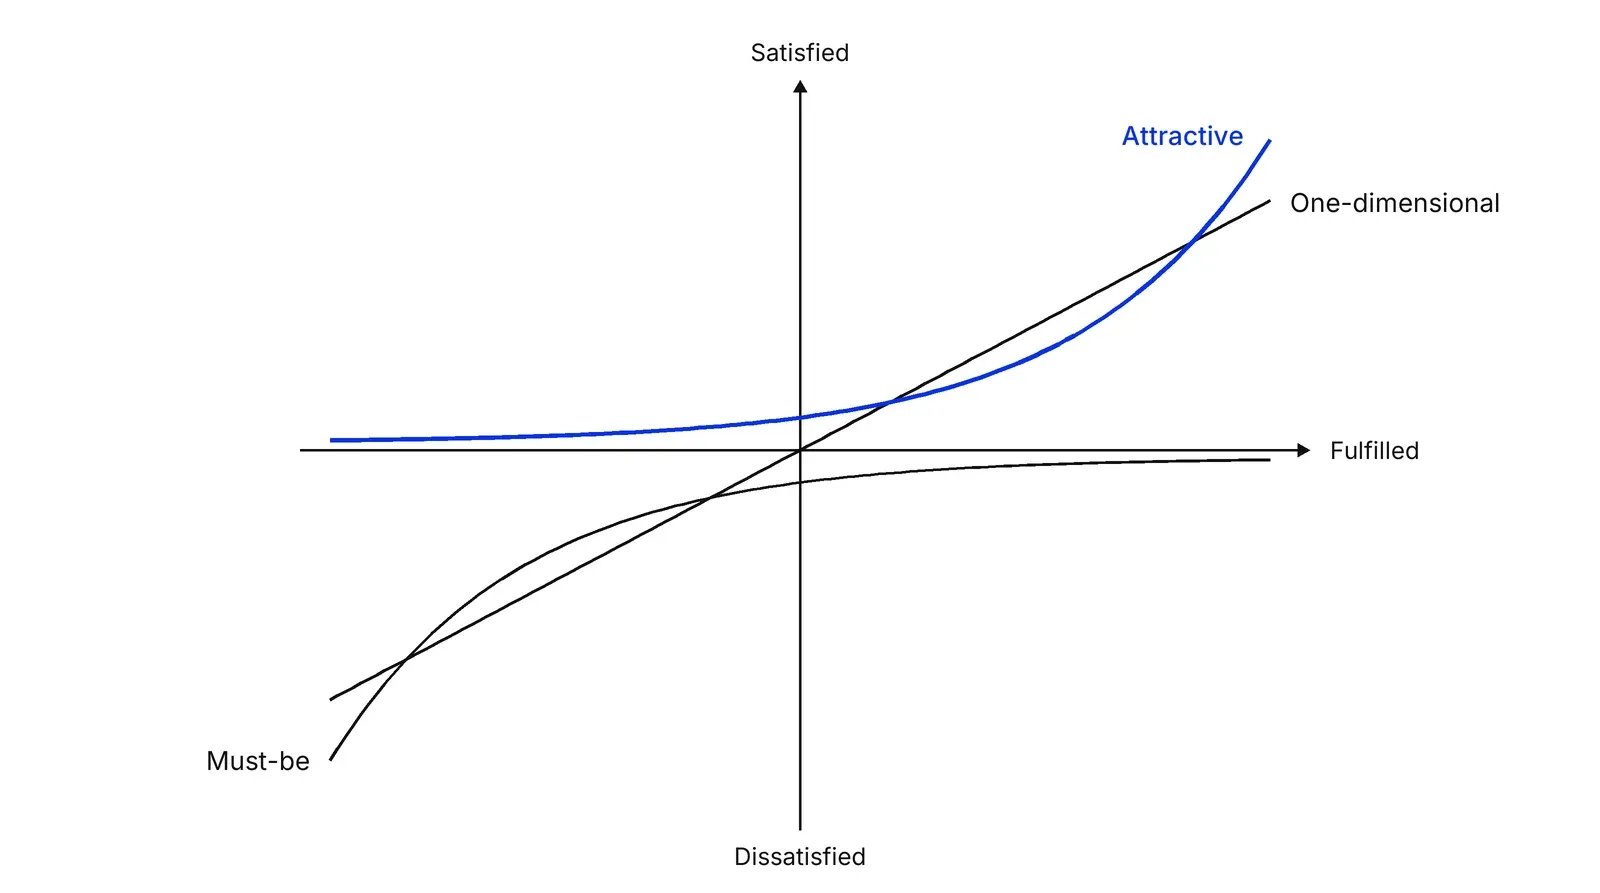
The CQM journal uses a car to show the shapes. Good brakes do not make a driver happy, but poor brakes make them furious. Fuel economy works like a dial: better mileage, more satisfaction. An aerial that retracts by itself when the radio is off was, at the time, a pleasant surprise nobody missed.
The five categories
The model sorts every feature into one of five categories, with a sixth code for answers that make no sense. Labels vary between sources: some write basic, performance and excitement, or must-have and delighter, for the first three.
| Category | If present | If absent | Car example from the CQM journal |
|---|---|---|---|
| Must-be (M) | No extra satisfaction | Strong dissatisfaction | Brakes |
| One-dimensional (O) | Satisfaction grows with performance | Dissatisfaction grows | Fuel economy |
| Attractive (A) | Delight | No dissatisfaction | Self-retracting aerial |
| Indifferent (I) | No effect | No effect | Cigarette lighter |
| Reverse (R) | Some customers dislike it | Those customers prefer it | None given |
Questionable (Q) is the sixth code. It marks a respondent who says they like a feature both when it is present and when it is absent, which usually means a badly worded question.
The questionnaire: two questions per feature
The Kano questionnaire asks about each feature twice. The functional question asks how the customer feels if the feature is present (“If the fuel economy is good, how do you feel?”). The dysfunctional question asks how they feel if it is absent or poor (“If the fuel economy is poor, how do you feel?”). Both offer the same five answers, which the CQM journal gives as: I like it that way, it must be that way, I am neutral, I can live with it that way, I dislike it that way.
The second question carries most of the information. A customer who would dislike the absence of a feature but feels neutral about its presence is telling you it is a must-be, something a single importance rating cannot show.
The evaluation table
Each pair of answers is looked up in a 5x5 evaluation table. The rows are the answer to the functional question, the columns the answer to the dysfunctional one. This is the table as published in the CQM journal in 1993.
| Functional \ Dysfunctional | Like | Must be | Neutral | Live with | Dislike |
|---|---|---|---|---|---|
| Like | Q | A | A | A | O |
| Must be | R | I | I | I | M |
| Neutral | R | I | I | I | M |
| Live with | R | I | I | I | M |
| Dislike | R | R | R | R | Q |
A customer who likes good fuel economy and dislikes poor fuel economy lands on O. One who expects a feature or is neutral about it, but dislikes its absence, lands on M.
Reading the results
The simplest reading takes the most frequent code for each feature. The CQM journal warns that this hides the spread: a feature rated attractive by 90 of 100 respondents and one rated attractive by 60 get the same label. Mike Timko of Analog Devices, writing in the same issue, proposed two scores. Better is (A+O)/(A+O+M+I), the share of customers whose satisfaction rises if you provide the feature. Worse is -(O+M)/(A+O+M+I), the share whose satisfaction falls if you do not. Plotted together, they rank features within and across categories.
The Innsbruck team added a tie-breaking rule, M>O>A>I: when a feature splits between categories, treat it as the one that would hurt most if ignored. The general guidance in both sources is the same: meet every must-be, be competitive on one-dimensional features, and add a few attractive ones.
Categories move over time
Categories drift, because features tend to slide from indifferent to attractive, then to one-dimensional and finally to must-be as customers get used to them.
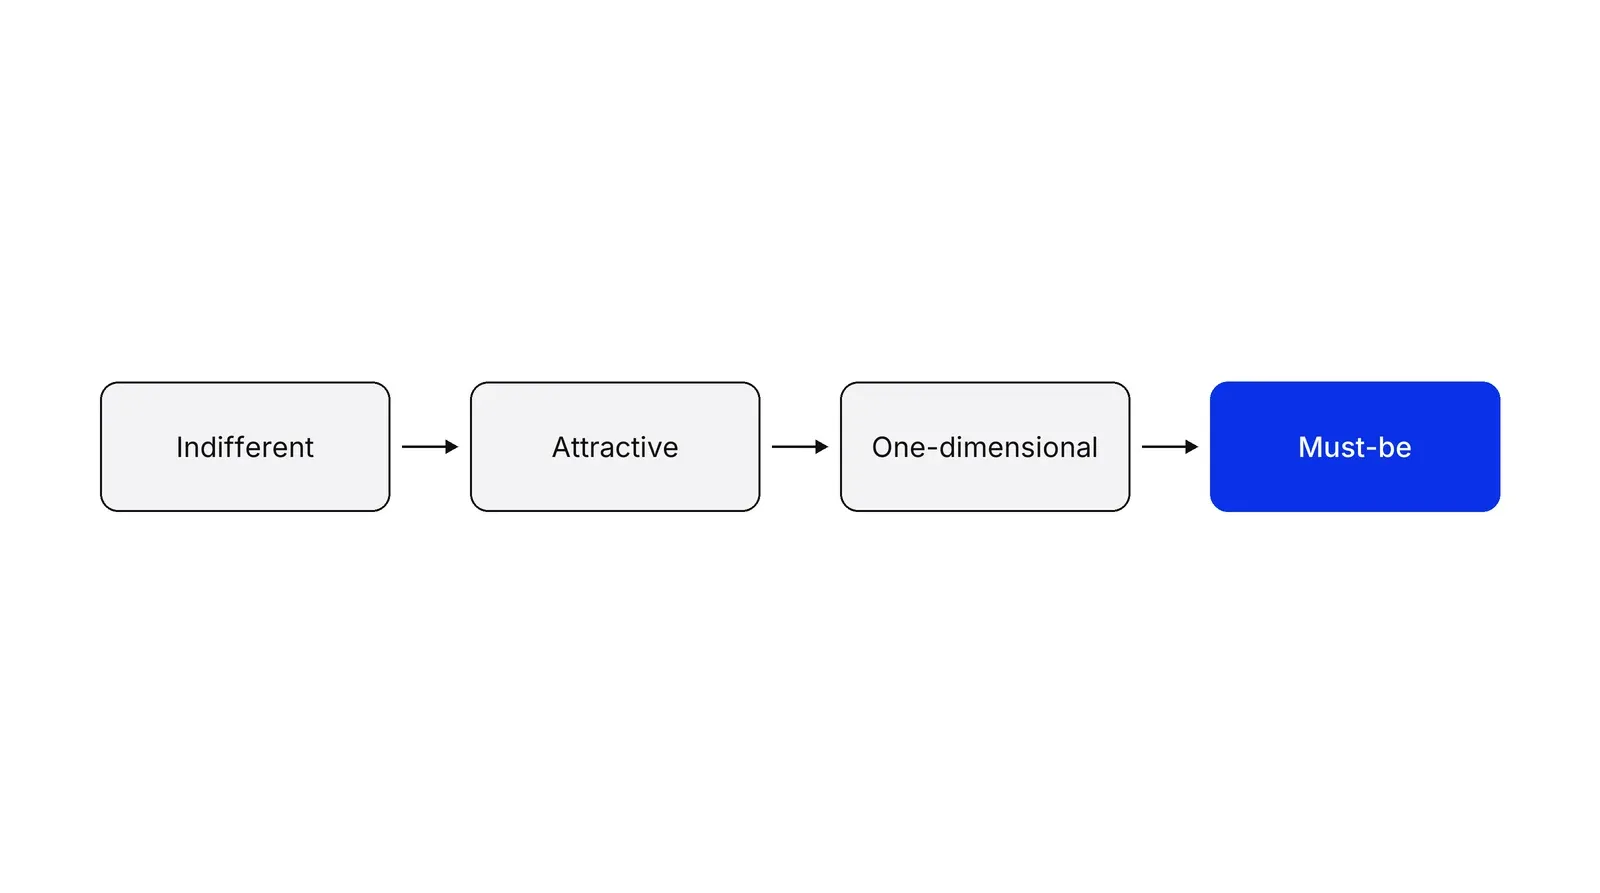
Nilsson-Witell and Fundin found an e-service that customers rated indifferent at launch and attractive a few years later, while early adopters already saw it as one-dimensional or must-be. Löfgren, Witell and Gustafsson surveyed 1,456 customers about 24 packaging attributes in 2003 and 2009 and found three patterns: attributes that followed the expected path, short-lived “flavor of the month” attributes and stable ones. Some moved backwards after a design change.
Limits of the method
The method shapes the answer. Witell and Löfgren classified the same attributes of an e-service with four approaches and 430 respondents and got different results depending on the approach. Mikulić and Prebežac concluded that only the Kano questionnaire and direct classification can classify features before a product exists.
Segments matter too. In healthcare, Materla, Cudney and Hopen surveyed 138 patients of a university health service and found 16 one-dimensional, 3 indifferent and 2 attractive attributes, with no must-be at all. They note that young respondents may expect less of a student clinic. A result that says “no must-be” more often signals a narrow sample than a market without basics.
Kano compared with MoSCoW and voice of the customer
| Method | Question it answers | Who decides |
|---|---|---|
| Kano model | How do customers react to a feature being present or absent? | Customers, through the survey |
| MoSCoW prioritization | What must this release deliver by its deadline? | The team and stakeholders |
| Voice of the customer | What needs do customers have, in their own words? | Customers, through interviews |
Voice of the customer finds the needs, Kano classifies them, and MoSCoW turns them into a release plan. In Pushers’ Growth Lab work, this order keeps a team from polishing a delighter while a must-be is still broken.
How to apply Kano model, step by step
- Collect candidate features from customers. Start from interviews, support tickets and sales notes, not from the backlog. Sauerwein and colleagues, citing Griffin and Hauser, say 20 to 30 interviews in one homogeneous segment surface most needs. Result: a list of 10 to 25 features, each phrased as something the customer would notice.
- Write a functional and a dysfunctional question for each. For every feature ask how the customer feels if it is present, then how they feel if it is absent, with the same five answers each time: I like it, I expect it, I am neutral, I can tolerate it, I dislike it. Test the wording on three customers before sending. Result: a questionnaire with two questions per feature.
- Run the survey in one segment at a time. Send it to customers who share a job and a level of experience, and add a few questions that identify the segment. Mixing novices and experts blurs the categories. Result: a set of paired answers per respondent, tagged by segment.
- Classify every answer pair with the evaluation table. Look up each respondent's functional and dysfunctional answer in the 5x5 table and record A, O, M, I, R or Q. Count the codes per feature. Result: a distribution of categories for every feature.
- Assign a category and compute Better and Worse. Take the most frequent category, but check the spread: a 60/40 split is not the same signal as 90/10. Then compute Better = (A+O)/(A+O+M+I) and Worse = -(O+M)/(A+O+M+I). Result: one category and two scores per feature.
- Turn the categories into roadmap decisions. Fix every must-be first, match the market leader on one-dimensional features, pick two or three attractive features for your segment, and drop indifferent ones. Re-run the survey every year or after a big market change. Result: a prioritised list the roadmap owner signs off.
Examples
Skis: one feature, two segments
Sauerwein, Bailom, Matzler and Hinterhuber at the University of Innsbruck ran Kano surveys with more than 1,500 ski customers. Edge grip on hard snow came out must-be for 49.3% of respondents, ease of turn one-dimensional for 45.1%, and free annual service of edges and base attractive for 63.8%. The split by skill changed the picture: expert skiers treated edge grip as must-be, while novices saw it as one-dimensional.
Primary care clinics in Saudi Arabia
Howsawi and colleagues surveyed 243 patients at 10 Ministry of Health primary care centres on 18 attributes. Fourteen came out one-dimensional, three attractive and one indifferent, with no must-be attribute. The attractive ones were a unified electronic medical record, educational films in the waiting room and advanced radiology such as MRI. Staff friendliness and the doctor's attention topped the one-dimensional list.
A payments app weighing two features
Illustrative, no real company implied. A payments app asks 120 users about instant payout to card and about two-factor login. Payout scores A 48, O 30, M 12, I 24 (6 reverse or questionable answers set aside), so Better is 78/114 = 0.68 and Worse is -42/114 = -0.37: an attractive feature. Two-factor login scores A 6, O 22, M 70, I 16, so Better is 0.25 and Worse is -0.81: a must-be. The team ships two-factor login first and markets instant payout.
When to use it
Use it when a backlog has more features than the team can build and the argument is about which ones customers will reward, when planning a new version of a mature product, or when a service team needs to separate the basics patients or clients expect from the extras that would set it apart. It works best with a defined segment and features concrete enough for a customer to picture.
When not to use it
Skip it when you do not yet know the customer's needs, because the survey only classifies features you already listed; run interviews or jobs to be done research first. It is also a poor fit for ranking dozens of internal or technical items customers never see, and for decisions driven by cost, regulation or deadlines, where MoSCoW or a scoring model is more direct.
Common mistakes
- Surveying a mixed audience. Experts and newcomers often put the same feature in different categories, and the mode then reflects whoever answered most.
- Reading only the mode. A feature voted attractive by 30 people and indifferent by 20 is a weaker case than one voted attractive by 30 and must-be by 20.
- Writing abstract questions such as 'If the product has good security'. Customers answer concrete situations more consistently than labels.
- Treating the result as permanent. Features drift towards must-be as competitors copy them, so last year's delighter can be today's minimum.
- Skipping must-be features because they do not raise satisfaction. They are the ones that lose customers when they fail.
FAQ
What are the five categories of the Kano model?
Must-be features cause dissatisfaction when missing but no extra satisfaction when present. One-dimensional features satisfy in proportion to how well they perform. Attractive features delight when present and are not missed when absent. Indifferent features change nothing either way. Reverse features annoy some customers when present. A sixth code, questionable, flags contradictory replies.
Who created the Kano model and when?
Noriaki Kano, a professor at Tokyo University of Science, developed it with Nobuhiko Seraku, Fumio Takahashi and Shin-ichi Tsuji. They first presented it at a 1982 meeting of the Japanese Society for Quality Control, and the society's journal published it as Attractive Quality and Must-Be Quality in its April 1984 issue.
How is the Kano model used for prioritization?
Fix every must-be feature first, compete with market leaders on one-dimensional features, then add a few attractive features that matter most to your segment. Sauerwein and colleagues call this the M>O>A>I rule. Better and Worse scores help rank features inside each category.
How do you calculate Better and Worse scores in a Kano survey?
Count the answers per category for one feature, leaving out reverse and questionable ones. Better equals (A+O) divided by (A+O+M+I) and shows how much satisfaction rises if you provide the feature. Worse equals minus (O+M) divided by the same total and shows how much it falls if you do not.
What is the difference between the Kano model and MoSCoW?
MoSCoW sorts requirements by what a fixed deadline must deliver, and the team decides the buckets. Kano sorts features by how customers react to their presence and absence, and the customers decide through a survey. Many teams run Kano first and use the result to argue the Must have list in MoSCoW.
Sources
- Noriaki Kano, Nobuhiko Seraku, Fumio Takahashi, Shin-ichi Tsuji, Attractive Quality and Must-Be Quality, Journal of the Japanese Society for Quality Control 14(2), 1984, J-STAGE
- Center for Quality of Management Journal 2(4), Kano's Methods for Understanding Customer-defined Quality (Berger, Blauth, Boger et al.), 1993
- Elmar Sauerwein, Franz Bailom, Kurt Matzler, Hans H. Hinterhuber, The Kano Model: How to Delight Your Customers, International Working Seminar on Production Economics, 1996
- Kurt Matzler, Hans H. Hinterhuber, Franz Bailom, Elmar Sauerwein, How to delight your customers, Journal of Product & Brand Management 5(2), 1996
- Noriaki Kano, Ishikawa Memorial Lecture and profile, World Quality Forum, International Academy for Quality, 2017
- Frederick Herzberg, One More Time: How Do You Motivate Employees?, Harvard Business Review
- Martin Löfgren, Lars Witell, Two Decades of Using Kano's Theory of Attractive Quality: A Literature Review, Quality Management Journal 15(1), 2008
- Lars Witell, Martin Löfgren, Jens J. Dahlgaard, Theory of attractive quality and the Kano methodology: the past, the present, and the future, Total Quality Management & Business Excellence 24(11-12), 2013
- Martin Löfgren, Lars Witell, Anders Gustafsson, Theory of attractive quality and life cycles of quality attributes, The TQM Journal 23(2), 2011
- Lars Nilsson-Witell, Anders Fundin, Dynamics of service attributes: a test of Kano's theory of attractive quality, International Journal of Service Industry Management 16(2), 2005
- Lars Witell, Martin Löfgren, Classification of quality attributes, Managing Service Quality 17(1), 2007
- Josip Mikulić, Darko Prebežac, A critical review of techniques for classifying quality attributes in the Kano model, Managing Service Quality 21(1), 2011
- Lars Witell, Martin Löfgren, Anders Gustafsson, Attractive Quality Creation: A Case Study of Microwave Ovens, 11th QMOD Conference, 2008
- Kurt Matzler, Hans H. Hinterhuber, How to make product development projects more successful by integrating Kano's model of customer satisfaction into quality function deployment, Technovation 18(1), 1998
- Kurt Matzler, Franz Bailom, Hans H. Hinterhuber, Birgit Renzl, Johann Pichler, The asymmetric relationship between attribute-level performance and overall customer satisfaction, Industrial Marketing Management 33(4), 2004
- Qianli Xu, Roger J. Jiao, Xi Yang, Martin Helander et al., An analytical Kano model for customer need analysis, Design Studies 30(1), 2009
- Abbie Griffin, John R. Hauser, The Voice of the Customer, Marketing Science 12(1), 1993
- Peter T. Lee, John F. Newcomb, Applying the Kano Methodology to Meet Customer Requirements: NASA's Microgravity Science Program, Quality Management Journal 4(3), 1997
- Anders Fundin, Dynamics of Quality Attributes Over Life Cycles of Goods and Services, doctoral thesis, Chalmers University of Technology, 2005
- Abdulaziz A. Howsawi et al., Application of the Kano model to determine quality attributes of patient's care at the primary healthcare centers of the Ministry of Health in Saudi Arabia, Journal of Family & Community Medicine 27(3), 2020
- Tejaswi Materla, Elizabeth A. Cudney, David Hopen, Evaluating factors affecting patient satisfaction using the Kano model, International Journal of Health Care Quality Assurance 32(1), 2019
- Feng-Han Lin et al., Empirical research on Kano's model and customer satisfaction, PLoS One 12(9), 2017
- Minnesota Department of Health, Public Health Quality Improvement Toolbox, Kano model
Last updated Oct 9, 2026


Marketing agency or growth system: when a company outgrows its agency
An agency is the right call while the founder still runs most of the company. Once the business starts copying itself into new locations or markets, it needs a system that sets goals, tests hypotheses and owns the result.

Why healthcare marketing agencies stall: the short, mid and long wins model we use with clinics
Most agencies own the click and nobody owns the front desk. How we structure clinic work in three horizons, the research behind each one, and one year of results.

Why channel tests stall after month three
Most paid channel tests do not end with a decision. They end when the budget runs out, the attribution model changes, or everyone quietly stops looking at the dashboard.