LTV:CAC ratio
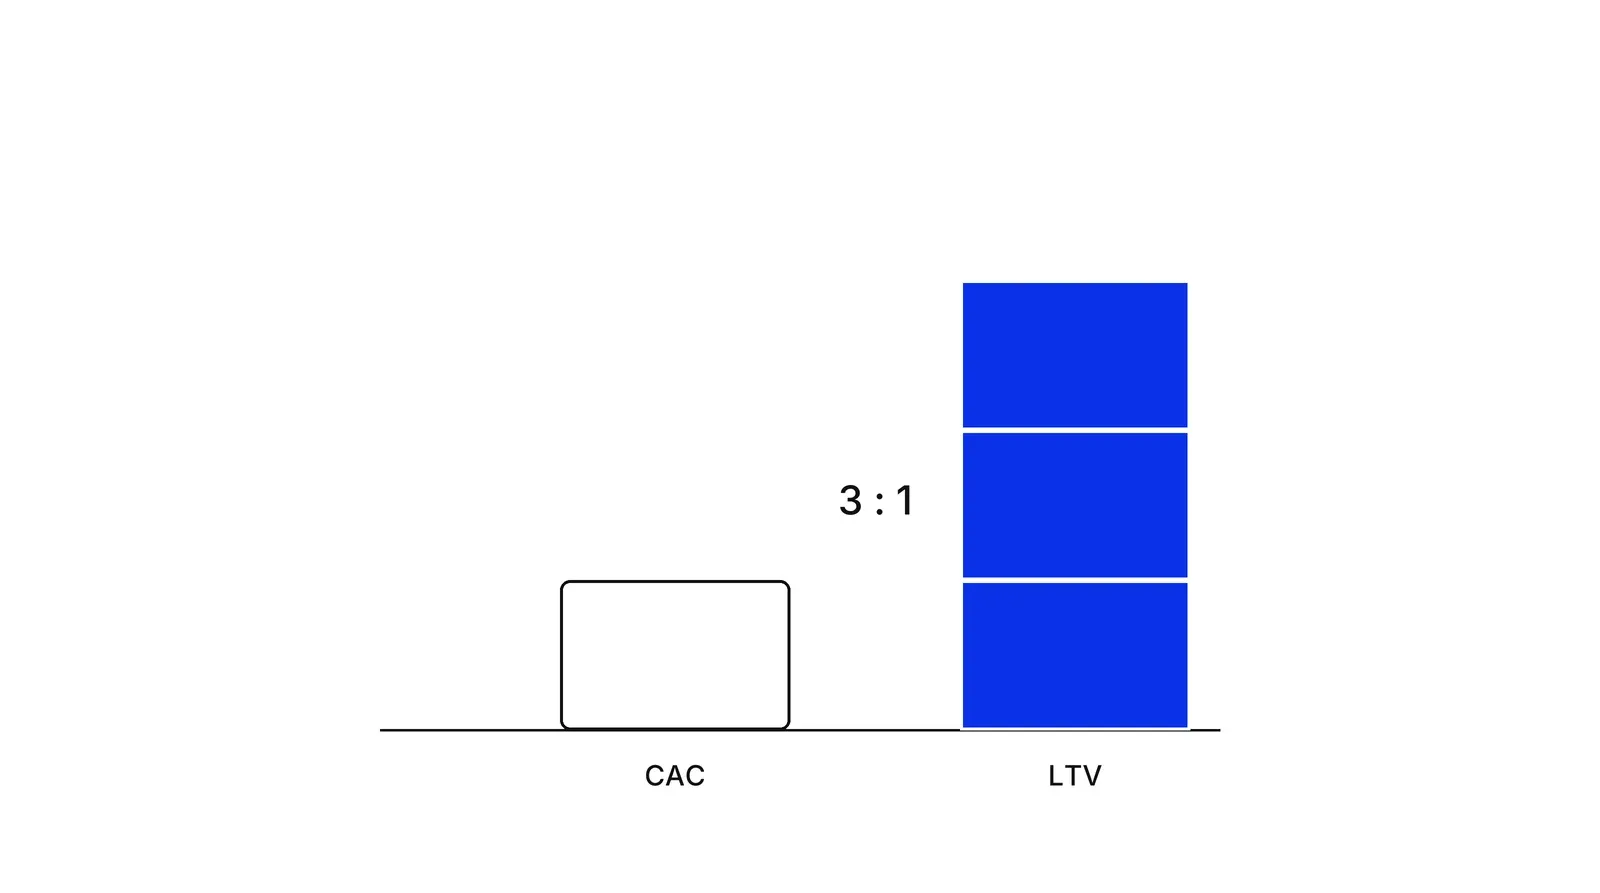
The LTV:CAC ratio divides the profit a customer is expected to bring over their lifetime by what it cost to win them, and the 3:1 rule of thumb asks for at least three dollars back for every dollar spent.
The LTV:CAC ratio compares the lifetime value of a customer, the profit they are expected to generate, with the customer acquisition cost, everything spent to win them. A ratio of 3:1 or higher is a rule of thumb from SaaS investing, not a law. The ratio is only as reliable as its two inputs, and lifetime value is the one that is easy to inflate.
- Origin
- David Skok (the 3:1 rule of thumb for SaaS); customer lifetime value research before him, Skok's original post is undated; the rule was in wide use by 2014
- Level
- 201 · Tool
- Fits
- Startup, Scale-up
- Time to apply
- Half a day for a first calculation, longer if cost data is scattered
- What you need
- monthly revenue per customer and the cost of serving each customer · a churn rate from real customer records, not an estimate · all sales and marketing spend for the period, including salaries
The LTV:CAC ratio is a customer’s lifetime value (LTV), the profit they are expected to bring, divided by the customer acquisition cost (CAC), what it took to win them. A customer worth three times the acquisition cost gives 3:1. The idea is older than SaaS: Robert Blattberg and John Deighton argued in Harvard Business Review that marketing spend should pass a “customer equity test”, a comparison of what a customer is worth with what it costs to get them.
Where does the 3:1 rule come from?
The best-documented source is the forEntrepreneurs blog of David Skok, a partner at Matrix Partners. His original SaaS metrics post says LTV must be at least 3 times CAC and that a startup should recover its acquisition cost in under 12 months. The post carries no date. The rewritten version softens the rule: the best SaaS businesses sit above 3, sometimes at 7 or 8, and many healthy ones fall short early on.
Skok presents these as guidelines, and the rule of thumb has traveled further than his caveats. Dave Kellogg, a SaaS executive and blogger, wrote that LTV:CAC “should be 3.0 or higher”. Andreessen Horowitz’s metrics guide, by contrast, never states a 3x benchmark; it only calls the ratio a good way to judge payback and manage marketing spend. So the figure is a convention from one investor’s pattern recognition, not a result tested across industries.
How do you calculate LTV and CAC?
LTV equals monthly revenue per customer, times the share left after the cost of serving them, divided by monthly churn. Skok’s formula multiplies revenue per user by customer lifetime, which he computes as one divided by churn, then subtracts the cost to serve. The a16z guide insists on the same thing from another angle: use net profit, not revenue, because a revenue-based LTV “suggests a higher upper limit” on what you can spend to acquire customers.
CAC is total sales and marketing spend divided by new customers won. Kellogg prefers to measure it per dollar of new recurring revenue and to leave customer success out, so that renewals do not blur the number. Whichever definition you pick, keep it fixed across periods.
Take the first example above: $200 a month, $160 of it left after serving costs and monthly churn of 2% give an LTV of $8,000, and CAC of $2,000 gives 4:1. Now see what ordinary choices do to that one business.
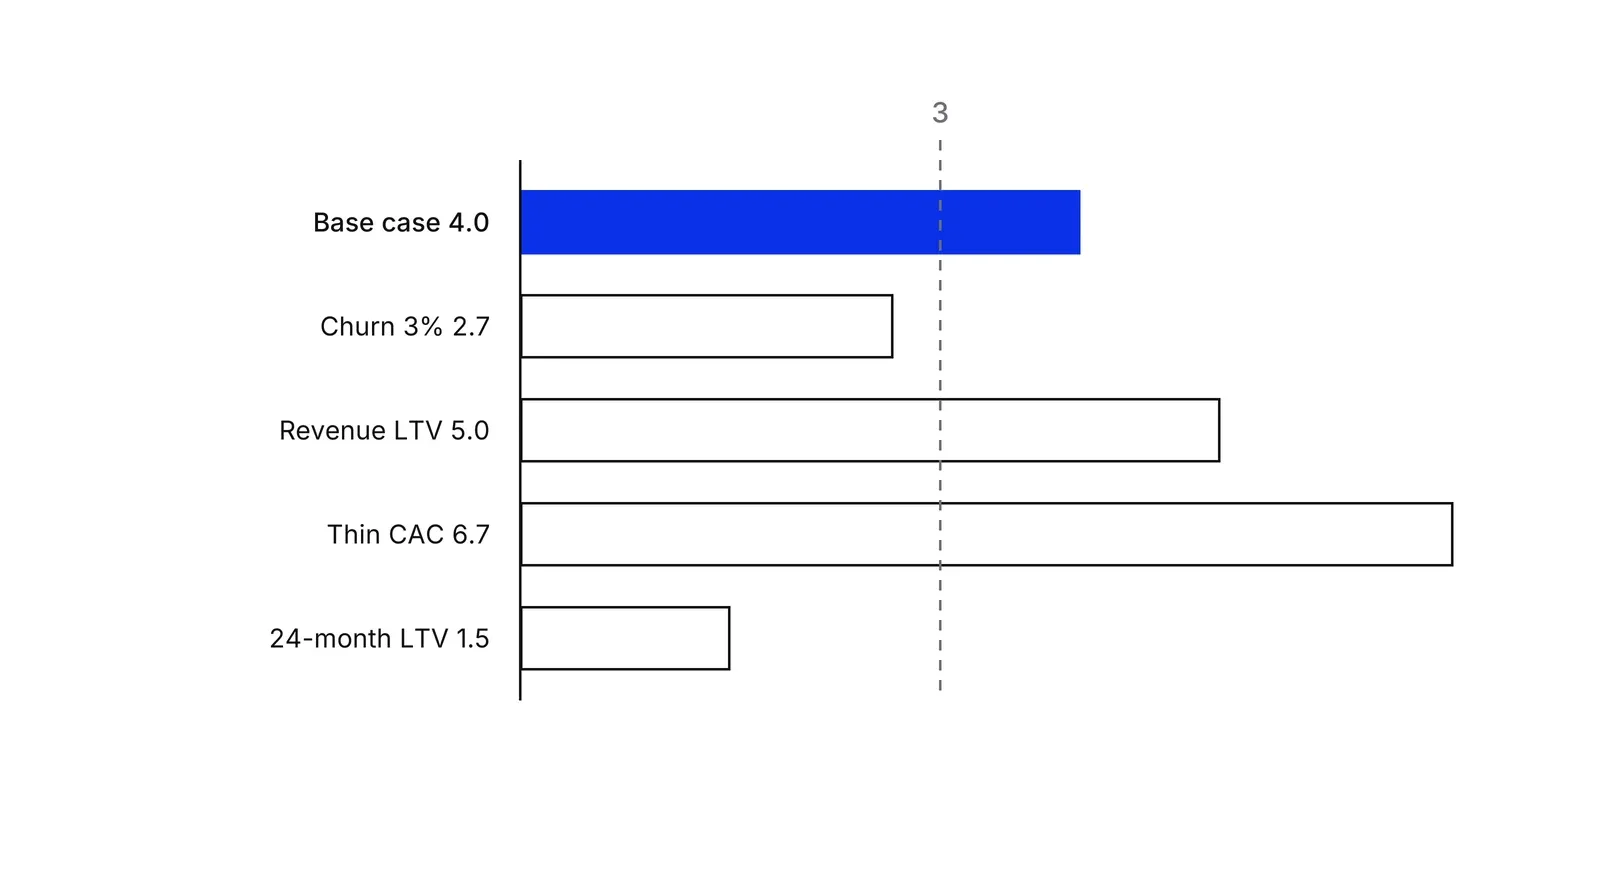
The bars use simple arithmetic on the illustrative business. Churn of 3% instead of 2% gives 2.7. Using revenue instead of margin gives 5.0. Dropping salaries from CAC, which then falls to $1,200, gives 6.7. Capping LTV at the 24 months actually observed, without discounting, gives about 1.5. One company, four defensible spreadsheets, and a result on either side of the 3:1 line.
Why does the ratio flatter, and when does it do the opposite?
Most of the damage comes from lifetime. Churn is measured over a short window and then turned into a lifetime through one divided by churn. Tunguz notes that most software companies see annual unit churn of 10% or less, so about 73 customers in 100 are still paying after three years, and LTV depends on projections that a young company cannot yet check. Kellogg adds that backward-looking churn may not predict future churn and that averages hide the distribution.
Bill Gurley’s 2012 critique makes related points. Inputs are not independent: raising prices tends to raise churn, and aggressive marketing can bring in customers who leave sooner. Organic customers should not be charged to marketing, but every future variable cost of serving a customer must be counted. He also warns that acquisition costs tend to rise as spend grows. Andrew Chen’s essay on channel decay describes the same pressure and gives an example where a 30% rise in CAC with a 30% fall in LTV could double the time to profitability.
The error can run the other way. Fader and Hardie showed in Marketing Science that a single average retention rate misstates value when customers differ, because high-churn customers leave early and cohort retention rises over time. In their hypothetical contractual business, the textbook calculation understated the value of the customer base by 38%. Gupta, Lehmann and Stuart found that a 1% gain in retention lifts customer value by 3 to 7%, while acquisition cost has far less leverage, with elasticities of 0.02 to 0.3. A cohort view, such as cohort analysis, shows which direction your own error runs, and net revenue retention shows whether expansion revenue changes the lifetime story.
How does it differ from CAC payback?
CAC payback is the number of months of gross profit needed to earn back what a customer cost. LTV:CAC measures return over the whole life. They disagree often enough to need each other.
| LTV:CAC | CAC payback | |
|---|---|---|
| Question | Is the customer worth winning? | How long is cash at risk? |
| Needs | A lifetime estimate | Margin and CAC only |
| Weak spot | Lifetime forecasts | Ignores churn after the payback point |
| Skok’s guideline | At least 3:1 | Under 12 months |
Tunguz gives an example of conflict: a business with a 5-month payback and monthly churn of 10% still had an LTV:CAC of only 1.2. Kellogg shows the other side. With monthly churn of 3%, CAC of $3,500, a 70% margin and a $150 fee, the standard formula gives 33 months, yet the cost is effectively never recovered once churn is counted. Read the ratio together with CAC payback period, and measure margin the way contribution margin does. For a subscription model the pair is the minimum dashboard.
A Growth Lab plan starts from this kind of ratio, then tests which input to change first: Growth Lab.
How to apply LTV:CAC ratio, step by step
- Choose the unit and the period. Decide whether you measure per customer, per account or per plan, and which months of data you use. Mixing a self-serve plan with enterprise contracts in one number hides both. Result: one segment and one time window to calculate on.
- Calculate contribution-based LTV. Take monthly revenue per customer, multiply by the share left after the variable cost of serving them (see contribution margin), and divide by monthly churn. Result: lifetime value in profit, not revenue.
- Calculate fully loaded CAC. Add all sales and marketing spend for the period, including salaries, tools, agency fees and discounts, and divide by the number of customers actually won. Exclude customers who would have arrived anyway only if you can show who they are. Result: one honest cost per new customer.
- Divide, then stress the inputs. Divide LTV by CAC. Then recalculate with churn one point worse, with a 24-month LTV instead of a lifetime one, and with revenue instead of profit, to see how far the answer moves. Result: a ratio and a range around it.
- Read it beside payback and cohorts. Compare the ratio with the months it takes to earn CAC back, and check it against real cohorts. Result: a decision on whether to spend more on acquisition, hold, or fix retention first.
Examples
A B2B SaaS company
Illustrative. A customer pays $200 a month, $160 stays after hosting and support, and monthly churn is 2%. LTV is $160 / 0.02 = $8,000. Fully loaded CAC is $2,000 per customer, so the ratio is 4:1 and payback takes 12.5 months. If churn is really 3%, the ratio falls to 2.7:1.
A clinic with a paid membership plan
Illustrative. A dental clinic sells a $40 monthly plan that leaves $24 after hygienist time and consumables, and monthly churn is 2.5%. LTV is $24 / 0.025 = $960. If advertising and front-desk time for one new member come to $300, the ratio is 3.2:1, with payback in 12.5 months.
A payments startup
Illustrative. A merchant brings $90 a month in gross profit after processing costs, and monthly churn is 4%. LTV is $90 / 0.04 = $2,250. Sales effort per won merchant totals $1,500, so the ratio is 1.5:1 and payback is 16.7 months. The business is not yet ready to spend more on acquisition.
When to use it
Use it for recurring-revenue businesses with a stable product and a few quarters of churn data, to judge whether acquisition spend can be raised, held or cut, and to compare channels or segments on the same basis. It works best as one of three or four numbers next to payback, churn and net revenue retention.
When not to use it
Skip it before you have real retention data: a ratio built on a guessed lifetime tells you what you hope, not what is happening. Skip it for one-off purchases with no repeat behavior, where customer lifetime is not defined. Never use it alone to justify a large increase in spend.
Common mistakes
- Calculating LTV from revenue instead of profit. A revenue-based LTV can overstate the ratio by the full cost of serving the customer, so use the margin that is left after variable costs.
- Leaving salaries and tools out of CAC. Brad Coffey of HubSpot, quoted by David Skok, asks that CAC account for all costs, and a thin CAC is the quickest way to a flattering ratio.
- Using one blended average. A blended ratio can hide a channel at 1.5:1 behind one at 5:1, as HubSpot's direct and channel sales showed in Skok's account.
- Treating 3:1 as a target in itself. Skok calls his thresholds guidelines, and a ratio far above 3 can mean the company is underspending on growth.
- Trusting a forecast lifetime. Tomasz Tunguz points out that a company one to three years into selling cannot yet forecast how long customers stay.
FAQ
What is a good LTV:CAC ratio?
3:1 or higher is the usual rule of thumb in SaaS, popularized by David Skok. Dave Kellogg gives the same 3.0 floor. Both treat it as a guideline: a ratio well above 3 can mean you are not investing enough in growth, and an early-stage ratio rests on guessed lifetimes.
How do you calculate LTV:CAC?
LTV is monthly revenue per customer times gross margin, divided by monthly churn. CAC is total sales and marketing spend divided by new customers won. Divide LTV by CAC. With $200 a month, 80% margin, 2% churn and $2,000 CAC, the ratio is 4:1.
Who came up with the 3:1 rule?
The best-documented source is David Skok's forEntrepreneurs blog, where his SaaS metrics post says LTV must be at least 3 times CAC and CAC should be recovered in under 12 months. The post is undated. Customer lifetime value as an idea is older and comes from direct marketing and academic research.
Is LTV:CAC better than CAC payback?
They answer different questions. Payback shows how long cash is tied up, and LTV:CAC shows the return over a lifetime. Tunguz prefers payback for young companies because it needs 14 to 18 months of data, while LTV needs years. Kellogg treats payback as a risk measure and LTV:CAC as the return measure.
Why is my LTV:CAC ratio so high?
Common causes are a revenue-based LTV, a lifetime taken from a few quarters of low churn, a CAC that leaves out salaries or counts free organic sign-ups as paid, and a blended average. Recalculate with gross margin, fully loaded CAC and a capped 24-month lifetime before you celebrate.
Sources
- David Skok, SaaS Metrics 2.0: A Guide to Measuring and Improving What Matters, forEntrepreneurs
- David Skok, SaaS Metrics: A Guide to Measuring and Improving What Matters (original post), forEntrepreneurs
- forEntrepreneurs, About David Skok (Matrix Partners)
- Bill Gurley, The Dangerous Seduction of the Lifetime Value (LTV) Formula, Above the Crowd, 4 September 2012
- Andreessen Horowitz, 16 Startup Metrics, 21 August 2015
- Dave Kellogg, The Ultimate SaaS Metric: LTV/CAC, Kellblog, 30 July 2014
- Dave Kellogg, CAC Payback Period: The Most Misunderstood SaaS Metric, Kellblog, 17 March 2016
- Dave Kellogg, The Customer Acquisition Cost (CAC) Ratio: Another Subtle SaaS Metric, Kellblog, 1 December 2013
- Dave Kellogg, You Can't Fix a CAC Payback Period, Kellblog, 11 October 2022
- Tomasz Tunguz, The False Confidence of the LTV/CAC Ratio for Early Stage SaaS Startups, 9 November 2017
- Tomasz Tunguz, A New Way to Calculate a SaaS Company's Efficiency, 1 December 2018
- Tomasz Tunguz, Why Lifetime Value is Relevant Again in Software, 15 October 2024
- Peter S. Fader, Bruce G. S. Hardie, Customer-Base Valuation in a Contractual Setting: The Perils of Ignoring Heterogeneity, Marketing Science 29(1), 2010
- Peter S. Fader, Bruce G. S. Hardie, How to Project Customer Retention, Journal of Interactive Marketing 21(1), 2007, author page
- Sunil Gupta, Donald R. Lehmann, Jennifer Ames Stuart, Valuing Customers, Journal of Marketing Research 41(1), 2004, Columbia Business School copy
- Lauren Keller Johnson, The Real Value of Customer Loyalty, MIT Sloan Management Review, 15 January 2002
- Knowledge at Wharton, What Are Your Customers Really Worth?, 28 February 2007
- Knowledge at Wharton, Peter Fader on Customer Centricity and Why It Matters, 18 November 2011
- Robert C. Blattberg, John Deighton, Manage Marketing by the Customer Equity Test, Harvard Business Review, July-August 1996
- Detlef Schoder, The Flaw in Customer Lifetime Value, Harvard Business Review, December 2007
- Andrew Chen, The Law of Shitty Clickthroughs
Last updated Oct 9, 2026


How to calculate channel payback and unit economics
A CAC number that only marketing believes will not survive a finance review. This guide calculates channel payback so both teams work from the same model.

Fractional CFO vs finance operations: which gap do you actually have
A fractional CFO is a person. Finance operations is a system. Companies searching for one are often missing the other, or both.