Minimum detectable effect and sample size
The minimum detectable effect is the smallest lift an A/B test is built to catch; together with the baseline, the significance level and power it fixes how many users the test needs and how long it must run.
The minimum detectable effect (MDE) is the smallest true difference between control and variant that an A/B test is designed to detect, usually with 80% power at a 5% significance level. With the variance of the metric it sets the sample size: about 16σ²/δ² users per variant, so halving the MDE quadruples the traffic a test needs.
- Origin
- Robert Lehr (16σ²/δ² equation); Gerald van Belle (rule of thumb); popularised for web tests by Ron Kohavi and colleagues and by Evan Miller, 1992; 2002; 2007 to 2010
- Level
- 301 · Advanced
- Fits
- Small and mid-size, Scale-up
- Time to apply
- 30 minutes per test once you have four weeks of baseline data
- What you need
- four weeks of history for the metric you will test: its mean and, for non-binary metrics, its standard deviation · daily or weekly count of users who will actually see the change · a business answer to: what is the smallest lift worth shipping?
The minimum detectable effect (MDE) is the smallest true difference between control and variant that an A/B test is built to detect reliably. You choose it before launch, and it decides how many users the test needs. Pick a small MDE and the test needs a lot of traffic; pick a large one and the test is cheap but blind to modest wins.
The planning maths comes from clinical statistics. Robert Lehr published the 16σ²/δ² shortcut in Statistics in Medicine in 1992, and Gerald van Belle’s Statistical Rules of Thumb made it a rule to memorise. Ron Kohavi’s team at Microsoft brought it to web experiments, and Evan Miller’s 2010 essay How Not To Run an A/B Test and his free calculator put it in front of most growth teams.
The four numbers that set sample size
Sample size follows from four inputs, and you can only choose three of them freely. The NIST engineering handbook gives the general formula: required n grows with the variance of the metric and shrinks with the square of the effect you want to detect.
| Input | What it means | Usual value |
|---|---|---|
| Significance level (alpha) | Chance of declaring a winner when there is no real difference | 5%, two-sided |
| Power (1 - beta) | Chance of a significant result when the true effect equals the MDE | 80% |
| Variance (σ²) | How noisy the metric is; for a conversion rate p it is p(1 - p) | From the last four weeks of data |
| MDE (δ) | The smallest absolute difference you want to catch | Set by the business and by past tests |
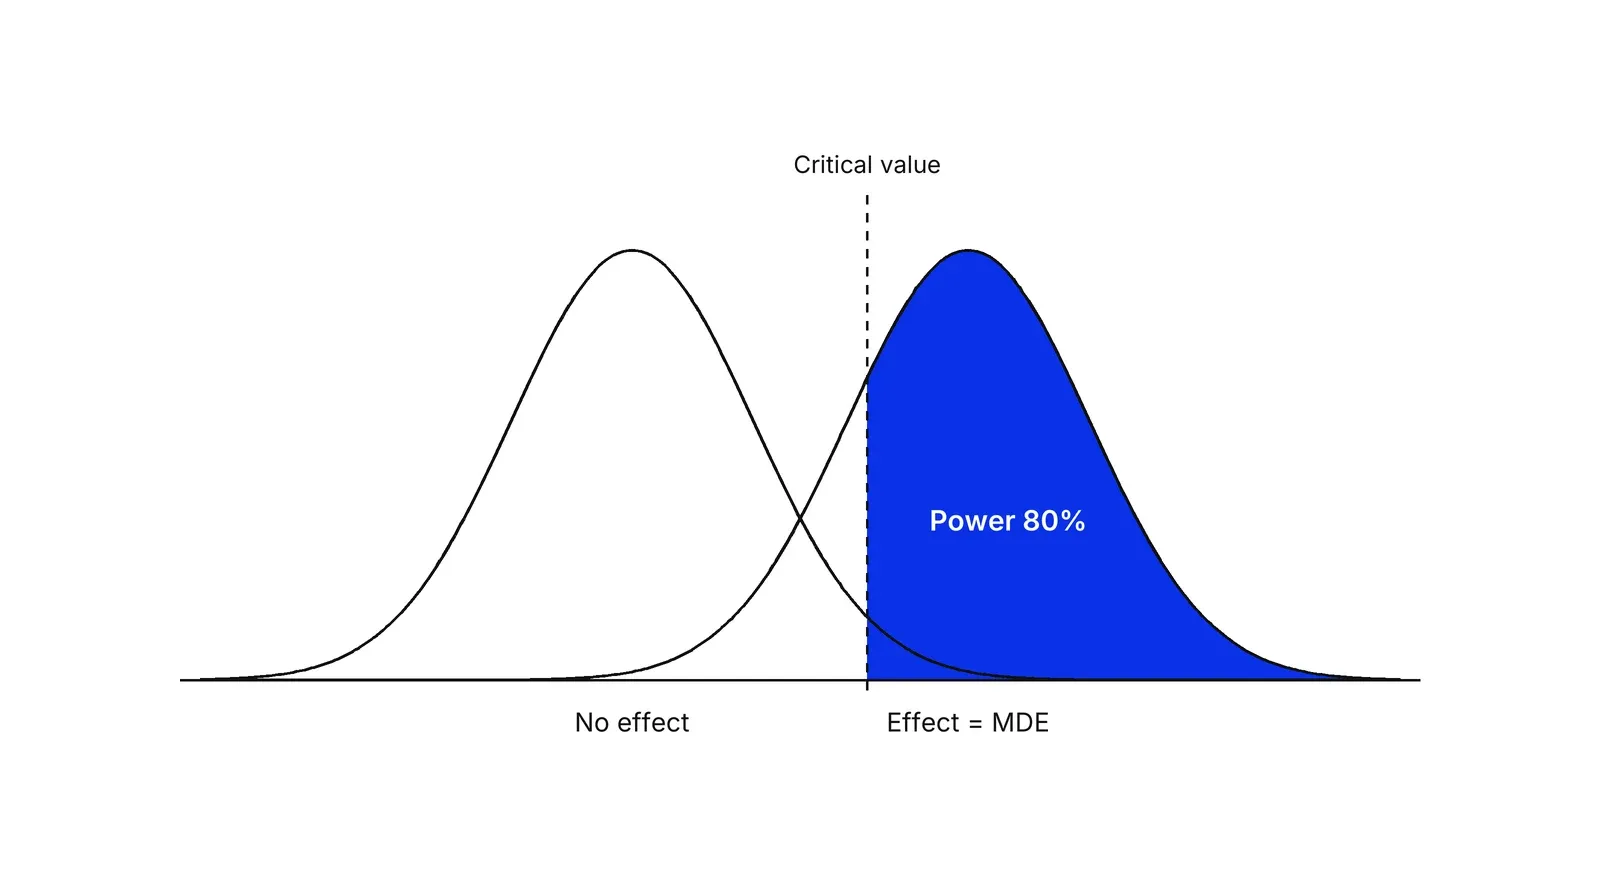
Power is the input people skip. A test with 50% power is a coin flip on whether it finds a real effect of the size you planned for. Platforms such as GrowthBook and Statsig default to 80% power and 5% alpha, and GrowthBook notes the 80% convention is borrowed from clinical trials.
Where does 16σ²/δ² come from?
The rule says each variant needs about 16σ²/δ² users for 5% two-sided significance and 80% power. The 16 is a rounded constant: the z-value for 5% two-sided significance is 1.96 and the z-value for 80% power is 0.84, and 2 x (1.96 + 0.84)² = 15.7. Van Belle rounds it up to 16. For 90% power the constant becomes 21, which Kohavi and colleagues’ 2009 survey states directly.
The Kohavi papers do not all print the same formula. The 2007 KDD guide used Robert Wheeler’s 1974 version, n = (4rσ/Δ)² at 90% power, and warned it may overestimate. The 2009 survey and the 2026 paper in Econ Journal Watch use 16σ²/δ² per variant and call Wheeler’s form more conservative. This page uses the 16 version.
A worked example: 5% conversion, 10% lift
Take a checkout page that converts 5% of visitors. You want to detect a 10% relative lift, from 5.0% to 5.5%, so δ = 0.005 and σ² = 0.05 x 0.95 = 0.0475. The rule gives 16 x 0.0475 / 0.005² = 30,400 users per variant, or 60,800 in total.
Exact methods land close by (all three computed in Python):
| Method | Users per variant |
|---|---|
| Rule of thumb, 16σ²/δ² | 30,400 |
| Evan Miller’s calculator formula | 30,244 |
| statsmodels, arcsine effect size and NormalIndPower | 31,217 |
With 4,000 eligible visitors a day, 60,800 users take 15.2 days. Round up to three full weeks: the 2009 survey recommends running at least a week or two and then in whole weeks, because weekend visitors often behave differently.
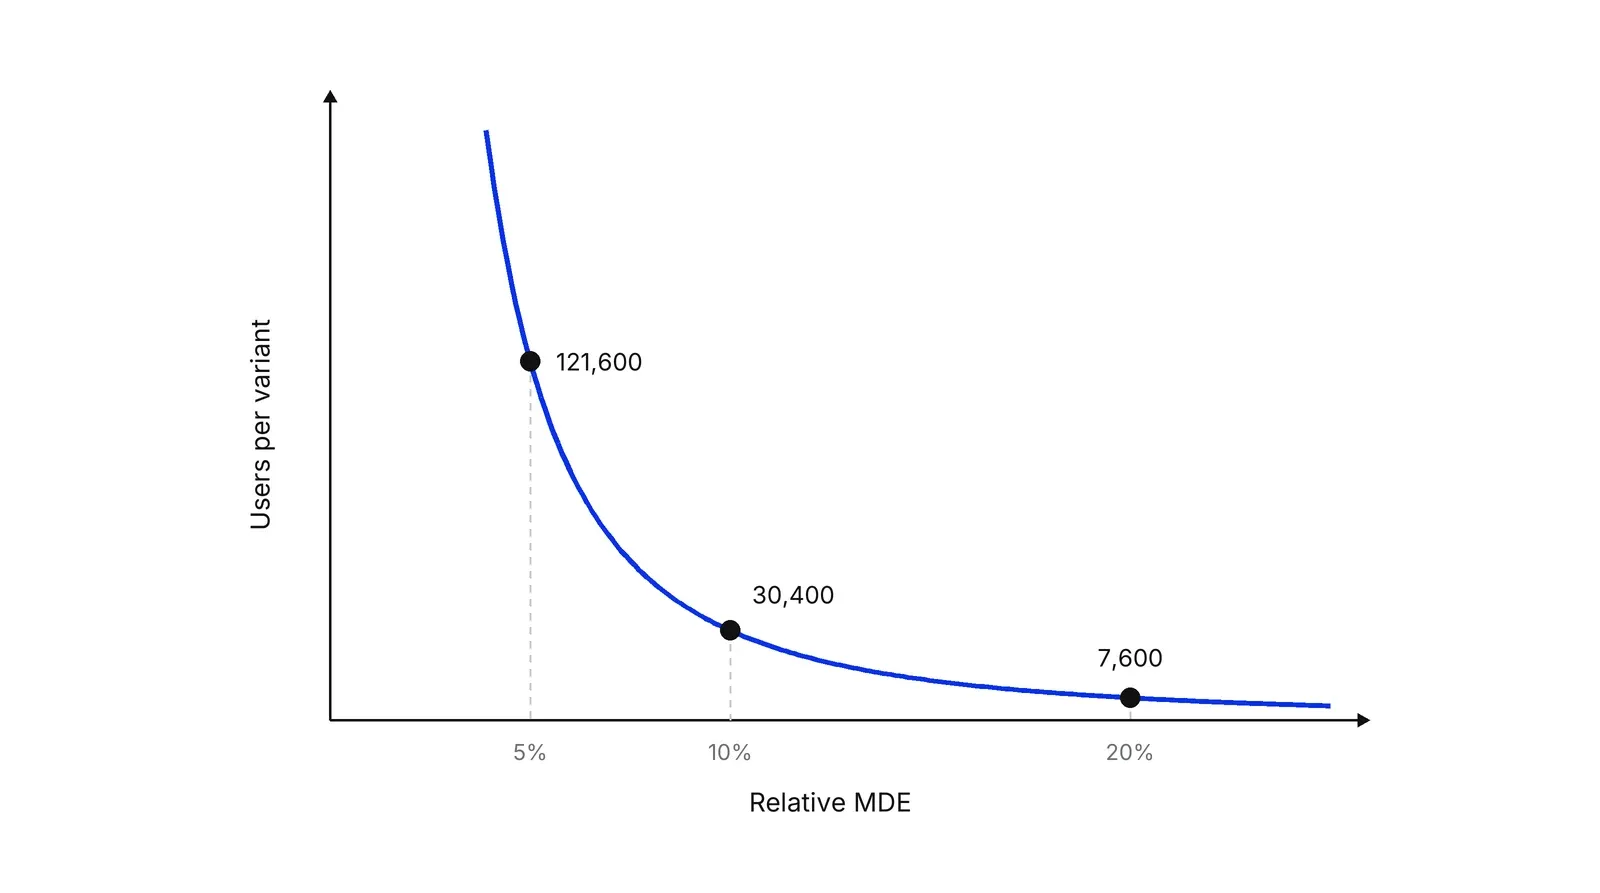
The δ² in the denominator is what makes MDE expensive. Detecting a 5% lift instead of 10% needs 121,600 users per variant, four times as many. Detecting 20% needs 7,600.
What MDE can your traffic detect?
Most teams have fixed traffic, so the useful question runs backwards: given n users per variant, what is the smallest effect the test can catch? Rearranged, the rule gives MDE ≈ 4σ/√n.
| Users per variant | MDE at a 5% baseline (points) | Relative MDE |
|---|---|---|
| 10,000 | 0.87 | 17.4% |
| 20,000 | 0.62 | 12.3% |
| 40,000 | 0.44 | 8.7% |
| 100,000 | 0.28 | 5.5% |
If your planned change can plausibly move conversion by 3% and your traffic only resolves 12%, the test will almost certainly come back flat, and flat will tell you nothing. Optimizely’s guidance makes the same link between MDE, traffic and test duration.
How to choose the MDE
Start from money: the smallest lift that would pay for building and maintaining the change. Then check it against history. In the 2026 paper, Kohavi and seven co-authors write that lifts in the experiments they reviewed are “typically under one percent, and rarely over two or three percent.” Small lifts can still be large in money. The Bing headline test Kohavi and Stefan Thomke describe raised revenue by 12%, worth over $100 million a year in the US, and that size of win is rare.
Why underpowered tests mislead
A significant result from a small test is likely to overstate the effect. Andrew Gelman and John Carlin call this the exaggeration ratio. The 2026 paper shows it in practice: a published study of 919 visits reported a 55% click-through lift from rounded buttons. Three replications with 2.8, 2.2 and 1.9 million users found lifts of 0.16%, 0.29% and 0.73%, none significant at 5%. At a 2% MDE, the authors estimate the original test had about 3% power and an expected exaggeration of about 28 times.
Ways to need fewer users
- Cut variance. Microsoft’s CUPED method uses pre-experiment data and reduced variance by about 50% at Bing, the same power with half the users.
- Analyse only users who reached the changed page, as the 2007 guide advises.
- Split traffic 50/50. The 2009 survey gives the slowdown for unequal splits as 1/(4p(1-p)): a 90/10 split runs 2.8 times longer.
- Use fewer variants, since each one needs its own n.
- If you must look early, plan a sequential test, such as Evan Miller’s simple version or the always-valid p-values of Johari, Pekelis and Walsh.
In Pushers’ Growth Lab work, this calculation sits inside each HADI loop: no hypothesis goes live without a written MDE and an end date.
How to apply Minimum detectable effect and sample size, step by step
- Pick one primary metric and pull its baseline. Choose the metric the decision rests on, such as checkout conversion, and pull its rate and variance over the last four weeks for the users who will see the change. For a conversion rate p, the variance is p(1 - p). Result: a baseline and a variance written down.
- Set the MDE from the business case. Ask what lift would pay for building and maintaining the change, then compare it with the lifts your past tests produced. If past winners moved the metric 2% and you plan for 20%, the plan is fiction. Result: an absolute and a relative MDE, for example 0.5 points and 10%.
- Fix alpha and power before anything else. Use a 5% two-sided significance level and 80% power unless a regulator, a costly rollback or a safety issue calls for stricter values. Moving to 90% power multiplies the sample by about 1.34. Result: two numbers nobody changes after launch.
- Compute users per variant twice. First run the rule of thumb, n = 16σ²/δ², in your head or a spreadsheet. Then confirm it in a calculator or in code (statsmodels in Python, pwr in R). The two should agree within a few percent. Result: a sample size per variant you trust.
- Turn users into calendar time. Divide the total sample by the daily eligible traffic and round up to full weeks, so weekday and weekend users are both represented. If the answer is longer than about six weeks, change the plan: test a bolder change, move to a higher-traffic metric, cut variants or reduce variance. Result: a fixed end date.
- Write the plan down and do not stop early. Record metric, MDE, alpha, power, sample size and end date in the test brief before launch. Read the result once, at the end, unless you planned a sequential test. Result: a decision you can defend when the number disappoints.
Examples
Fintech onboarding flow
Illustrative. A payments app sees 3,000 new sign-ups a week, and 40% of them finish identity verification. The team wants to detect a 5% relative lift, from 40% to 42%. The rule gives 16 x 0.4 x 0.6 / 0.02² = 9,600 users per variant; Evan Miller's calculator formula gives 9,440. The test needs about 19,200 sign-ups, or 6.4 weeks of traffic, so it is planned for seven full weeks.
Clinic booking page with little traffic
Illustrative. A private clinic's booking page gets 3,000 visitors a month and converts 3% of them. Split 50/50 for one month, each version gets 1,500 visitors, and the smallest lift the test can reliably catch is about 1.8 percentage points, a 60% relative jump from 3% to 4.8%. Running four months brings it to about 0.9 points, or 30%. Small button tweaks will never clear that bar; the clinic should test bold changes or measure an earlier step with more traffic, such as clicks on the booking button.
Revenue per user versus conversion
Kohavi and colleagues' 2007 guide describes a shop where 5% of visitors buy, average spend per visitor is $3.75 and the standard deviation is $30. Plugging those inputs into the 16σ²/δ² rule for a 5% change gives 409,600 users per variant for revenue per visitor, against 121,600 for conversion rate. Same test, same traffic, more than three times the sample, only because revenue is a noisier metric.
When to use it
Use it before every A/B test, during planning, to decide whether the test can answer its question with the traffic you have, and to set a fixed end date. It is also the right tool when stakeholders ask why a test needs four weeks, or when a backlog of test ideas has to be sorted by which ones your traffic can actually resolve.
When not to use it
Skip the fixed-horizon calculation when you deliberately run a sequential or Bayesian test, which have their own planning rules, or when traffic is so low that even a 50% lift needs months: there, qualitative research, a pre/post comparison with clear caveats, or a decision made on judgment is more honest than a test that cannot detect anything.
Common mistakes
- Mixing absolute and relative MDE. A 10% lift on a 5% conversion rate is 0.5 percentage points; entering 10 points into a calculator understates the sample by a factor of 400.
- Choosing the MDE that makes the sample size fit the traffic, then calling the test powered. Past experiments, not the traffic budget, should tell you what effect is realistic.
- Stopping the test the first day it shows significance. Evan Miller showed that checking after every visitor can push a nominal 5% false positive rate to 26%.
- Counting every visitor to the site when only a fraction reach the changed page. Users who never saw the change add noise and inflate the required sample.
- Trusting a large, significant lift from a small test. Low power plus significance usually means the effect is exaggerated.
FAQ
What is a good minimum detectable effect for an A/B test?
One you can justify twice: the business would act on it, and similar past tests have produced lifts that size. Kohavi and seven co-authors wrote in 2026 that lifts in the experiments they have reviewed are typically under 1% and rarely above 2 to 3%, so an MDE of 20% on a mature product is usually wishful.
How do you calculate sample size for an A/B test?
Per variant, n ≈ 16σ²/δ², where σ² is the metric's variance and δ is the absolute MDE, for 5% significance and 80% power. For a conversion rate p, σ² = p(1 - p). A 5% baseline and a 0.5-point MDE give 30,400 users per variant. Check the result in a calculator.
What does 80% power mean in an A/B test?
If the variant improves the metric by exactly the MDE, a test with 80% power will show a significant result four times out of five and miss it once. Larger true effects are caught more often, smaller ones less often. The 80% convention comes from clinical and behavioural research.
What is the difference between absolute and relative MDE?
Absolute MDE is measured in the metric's own units, such as percentage points of conversion. Relative MDE is a share of the baseline. On a 5% conversion rate, a 10% relative MDE equals 0.5 points absolute. The sample size formula always needs the absolute value.
Can I stop an A/B test as soon as it is significant?
Not with a standard fixed-sample test. Each extra look gives random noise another chance to cross the line, so false positives rise well above 5%. Either run to the planned sample size or use a sequential method built for repeated looks, such as always-valid p-values.
Sources
- Evan Miller, Sample Size Calculator (Evan's Awesome A/B Tools)
- Evan Miller, How Not To Run an A/B Test, 2010
- Evan Miller, Simple Sequential A/B Testing, 2015
- Ron Kohavi, Randal M. Henne, Dan Sommerfield, Practical Guide to Controlled Experiments on the Web, KDD 2007
- Ron Kohavi, Roger Longbotham, Dan Sommerfield, Randal M. Henne, Controlled Experiments on the Web: Survey and Practical Guide, Data Mining and Knowledge Discovery 18, 2009
- Ron Kohavi, Diane Tang, Ya Xu, Trustworthy Online Controlled Experiments, Cambridge University Press, 2020
- Robert Lehr, Sixteen S-squared over D-squared: A Relation for Crude Sample Size Estimates, Statistics in Medicine 11(8), 1992
- Gerald van Belle, Statistical Rules of Thumb, chapter 2: Sample size
- Robert E. Wheeler, Portable Power, Technometrics 16(2), 1974
- Jacob Cohen, A Power Primer, Psychological Bulletin 112(1), 1992
- NIST/SEMATECH e-Handbook of Statistical Methods, Sample sizes required
- statsmodels documentation, NormalIndPower.solve_power
- statsmodels documentation, proportion_effectsize
- GrowthBook documentation, Power analysis
- Statsig documentation, Power analysis
- Optimizely documentation, Use minimum detectable effect when you design an experiment
- Alex Deng, Ya Xu, Ron Kohavi, Toby Walker, Improving the Sensitivity of Online Controlled Experiments by Utilizing Pre-Experiment Data (CUPED), WSDM 2013
- Andrew Gelman, John Carlin, Beyond Power Calculations: Assessing Type S and Type M Errors, Perspectives on Psychological Science 9(6), 2014
- Ron Kohavi, Alex Deng, Lukas Vermeer, A/B Testing Intuition Busters, KDD 2022 (author's version)
- Ramesh Johari, Leo Pekelis, David J. Walsh, Always Valid Inference: Bringing Sequential Analysis to A/B Testing, arXiv 1512.04922
- Ron Kohavi et al., Power Analysis is Essential, Econ Journal Watch 23(1), March 2026
- Ron Kohavi, Stefan Thomke, The Surprising Power of Online Experiments, Harvard Business Review, September-October 2017
- Microsoft Experimentation Platform, Patterns of Trustworthy Experimentation: Pre-Experiment Stage, 2020
- Katherine S. Button et al., Power Failure: Why Small Sample Size Undermines the Reliability of Neuroscience, Nature Reviews Neuroscience 14, 2013
Last updated Oct 9, 2026


Marketing agency or growth system: when a company outgrows its agency
An agency is the right call while the founder still runs most of the company. Once the business starts copying itself into new locations or markets, it needs a system that sets goals, tests hypotheses and owns the result.

Why healthcare marketing agencies stall: the short, mid and long wins model we use with clinics
Most agencies own the click and nobody owns the front desk. How we structure clinic work in three horizons, the research behind each one, and one year of results.

Why channel tests stall after month three
Most paid channel tests do not end with a decision. They end when the budget runs out, the attribution model changes, or everyone quietly stops looking at the dashboard.