Sales forecasting methods
Sales forecasting methods are the five common ways to estimate next quarter's revenue (pipeline-weighted, stage-probability, run-rate, judgmental commit and statistical), plus the error measures that show which one to trust.
Sales forecasting is the practice of estimating the revenue a team will book in a future period, usually a quarter. Five methods are common: pipeline-weighted, stage-probability, historical run-rate, judgmental commit and statistical models. Forecasting research finds that combining methods and scoring every forecast with MAPE and bias beats trusting any single method.
- Origin
- No single inventor; evidence from J. Scott Armstrong, Rob Hyndman and George Athanasopoulos, and Spyros Makridakis, Armstrong handbook 2001; M-competitions 2000, 2018, 2022
- Level
- 401 · Expert
- Fits
- Scale-up, Enterprise
- Time to apply
- one afternoon to set up a first scored forecast, then one hour per quarter to score it
- What you need
- a CRM export with the amount, stage history, created date and close date of every deal from the last four to six quarters · booked revenue by month or quarter for at least two years · someone in sales or finance who owns the number and keeps the forecast log
Sales forecasting is the practice of estimating how much revenue a team will book in a future period, most often the current quarter, so that hiring, spending and targets can be set against a number. No single person invented it. It grew out of sales management, while the evidence on what works comes from forecasting research: J. Scott Armstrong’s 2001 handbook Principles of Forecasting, the free textbook Forecasting: Principles and Practice by Rob Hyndman and George Athanasopoulos, and the M-competitions run by Spyros Makridakis and colleagues, where many forecasters predict the same data and the results are scored.
Practice lags behind. A 2006 survey of forecasting executives, compared with surveys from 1984 and 1995, reported that familiarity with techniques and accuracy had both decreased.
What are the five methods?
Each method answers how much we will book from a different input.
| Method | Input | Works best when | Typical failure |
|---|---|---|---|
| Pipeline-weighted | Open deal amount times one probability per stage | Many small deals | Probabilities are guesses nobody checks |
| Stage-probability | Win rates measured from past deals by stage and age | A year or more of clean CRM history | The sales process changed after the data was collected |
| Historical run-rate | Past bookings: last quarter, same quarter last year, a trailing average | A stable business with seasonality | Misses new reps, new pricing and pipeline shifts |
| Judgmental commit | Calls from reps and managers, sorted into categories | New segments, big deals, thin history | Optimism on one side, sandbagging on the other |
| Statistical | A model fitted to the bookings series, sometimes with leading indicators | A long, regular series | B2B series are short and break when the business changes |
How does a pipeline-weighted forecast work?
A pipeline-weighted forecast multiplies each open deal’s amount by its stage’s probability and sums the results. HubSpot’s forecast tool does this by default, using deal stages to estimate each deal’s likelihood to close and showing a weighted or a total pipeline. It is easy to build, and it has two weak points.
The first is where the probabilities come from: usually typed in once by whoever configured the CRM. The second is arithmetic. A weighted sum is an average over possible outcomes, and with few large deals no real outcome sits near it. Take three deals worth 100k dollars each, at 20% per deal. The weighted forecast is 60k. If the deals are independent, the quarter ends at 0 with a 51% chance, at 100k with 38%, at 200k with 10% and at 300k with under 1%. The team will never book 60k.
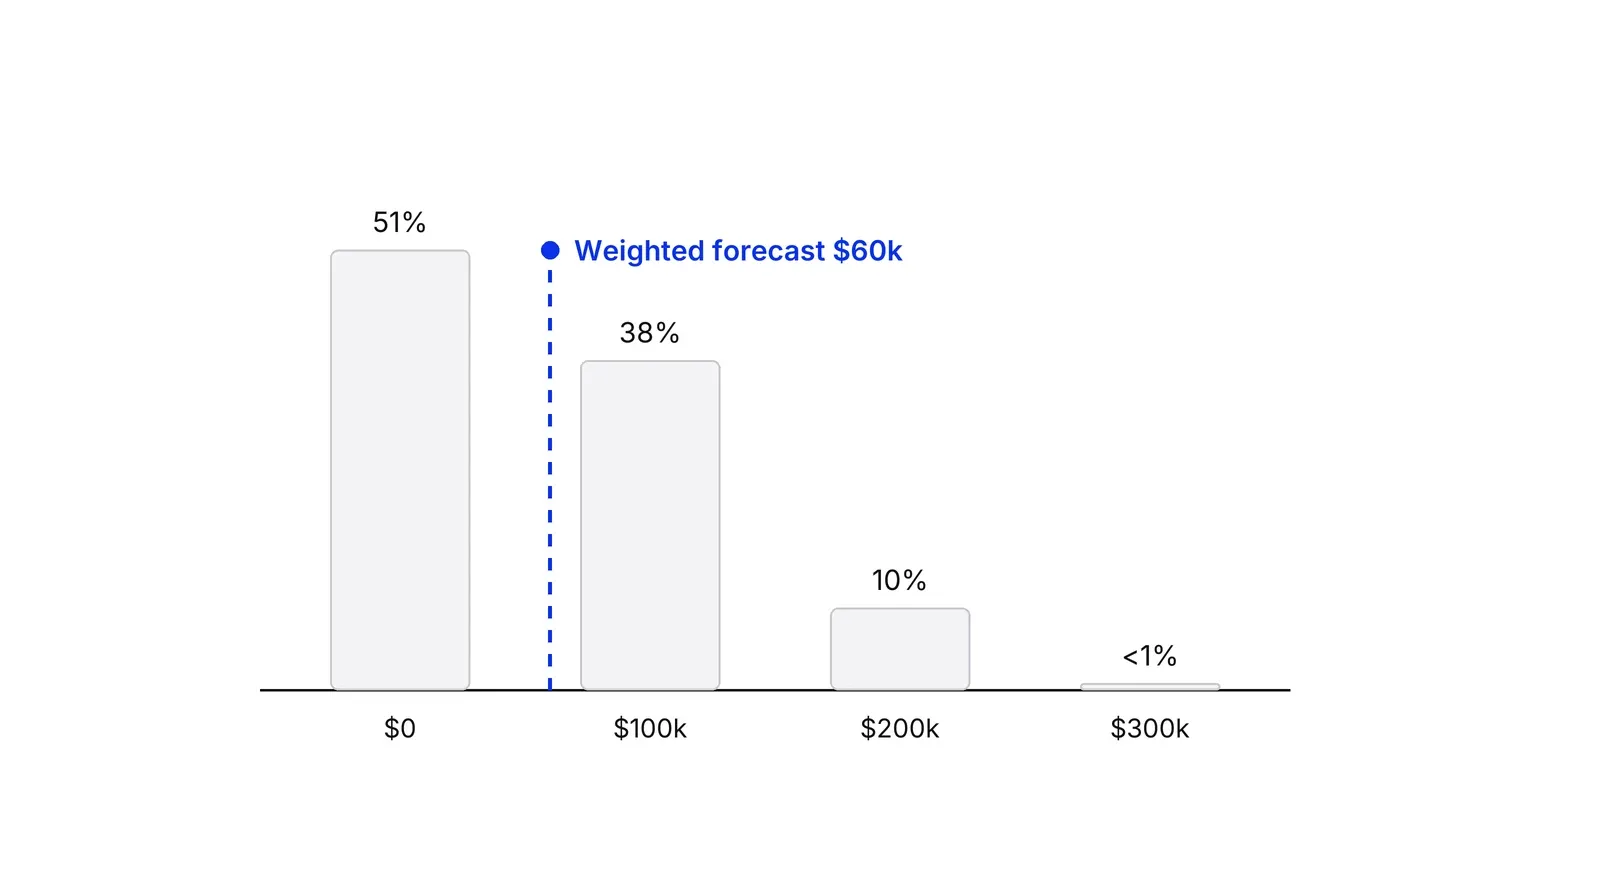
With dozens of deals the outcome clusters near the weighted figure; with a dozen large ones, read it as the middle of a range. As with any forecast, a single number needs a prediction interval beside it.
How do you get stage probabilities from history?
Stage probabilities from history replace the percentages typed into the CRM with win rates measured on past deals. For each stage, count how many deals that reached it in the last four to six quarters later closed won, split by segment and, where the data allows, by how long the deal has sat there.
Two details keep the rates honest. Group deals by the quarter they were created, as cohort analysis does, so deals still open are not counted as lost. And define each stage by exit criteria, as in sales process stages, because a rate on a stage reps enter by feel measures nothing.
This is close to what Bent Flyvbjerg calls reference class forecasting: base the forecast on the record of similar past cases, which sidesteps optimism and deliberate overstatement.
When is a run-rate forecast enough?
A run-rate forecast projects the future from past results with no model. Hyndman and Athanasopoulos list the simple versions: the mean of history, the naive forecast (the last value) and the seasonal naive forecast (the value from the same period a year ago). For sales these are last quarter’s bookings, the same quarter last year and a trailing average.
They are crude, cost nothing and set the bar: a method that cannot beat the seasonal naive forecast is not earning its keep. The next step is simple exponential smoothing, a weighted average where recent quarters count more.
What does the commit call add, and what does it cost?
A commit call is the judgmental forecast: reps and managers sort deals into categories such as commit, best case and pipeline. Judgment sees what no model can, such as a stalled legal review, and it is the main option when no data exist. A 2006 review calls it indispensable and also prone to bias.
The bias leans one way. Fildes and colleagues studied more than 60,000 forecasts from four supply-chain companies. Upward adjustments were much less likely to help than downward ones, small adjustments often hurt, and the authors read it as a general optimism bias. Lovallo and Kahneman make the wider case that business initiatives often fall short of plan.
The textbook fixes are procedural: keep forecasters apart from the people who set targets, write down the reasoning behind each call, and score the calls. A Delphi panel, with anonymous experts revising over a few rounds, suits big one-off deals.
Do statistical methods beat the others?
Statistical methods fit a model to the bookings series, for example exponential smoothing or ARIMA, and sometimes add a leading indicator such as pipeline created 90 days earlier. Whether they win depends on the data. Predictability depends on how well the drivers are understood, how much history exists, how closely the future resembles the past and whether the forecast itself changes the outcome. Sales often fails the last test, because a published number sets quotas.
The competitions give a sober picture. In the M4 competition, 12 of the 17 most accurate methods were combinations of mostly statistical approaches, and the six pure machine learning methods did poorly. In M5, on 42,840 Walmart unit-sales series with prices and events, machine learning won clearly, but in the authors’ preprint only 7.5% of the teams beat the best statistical benchmark. That data holds thousands of related daily series. A B2B team has one series of a few dozen points, so simple methods are the default.
Why combine methods?
Combining methods that differ is the best-supported step in the literature. Armstrong’s chapter reports that in 30 empirical comparisons, equally weighted combinations cut ex ante error by about 12.5% on average, with a range of 3% to 24%. Clemen’s 1989 review reached the same conclusion, adding that simple combinations often work about as well as complex ones. Average the weighted pipeline, the run-rate and the commit total, and use their spread as the range.
How do you measure forecast accuracy?
Measure accuracy with error, MAPE and bias, on forecasts logged before the quarter closed. Here error is forecast minus actual; the textbook uses the reverse.
MAPE, the mean absolute percentage error, averages each error divided by the actual. It is unit-free. Hyndman and Koehler note that it is undefined when an actual is zero and treats over- and under-forecasts unevenly. Bias is the mean of the signed errors. A mean other than zero means the forecasts are systematically off, and MAPE alone hides it because misses in both directions add up. MASE scales the error by the naive forecast’s error, and a value below one beats naive.
| Quarter | Forecast ($k) | Actual ($k) | Error ($k) | Absolute % error |
|---|---|---|---|---|
| Q1 | 520 | 480 | +40 | 8.3% |
| Q2 | 450 | 470 | -20 | 4.3% |
| Q3 | 600 | 540 | +60 | 11.1% |
| Q4 | 700 | 610 | +90 | 14.8% |
The illustrative table gives a MAPE of 9.6%, which looks decent. The mean error is +42.5k, a bias of 8.1 percent of the average actual, with three of four quarters high. Using last quarter’s actual as the naive forecast for Q2 to Q4 gives a MAPE of 8.9% against 10.0% for the forecast. The method lost to doing nothing.
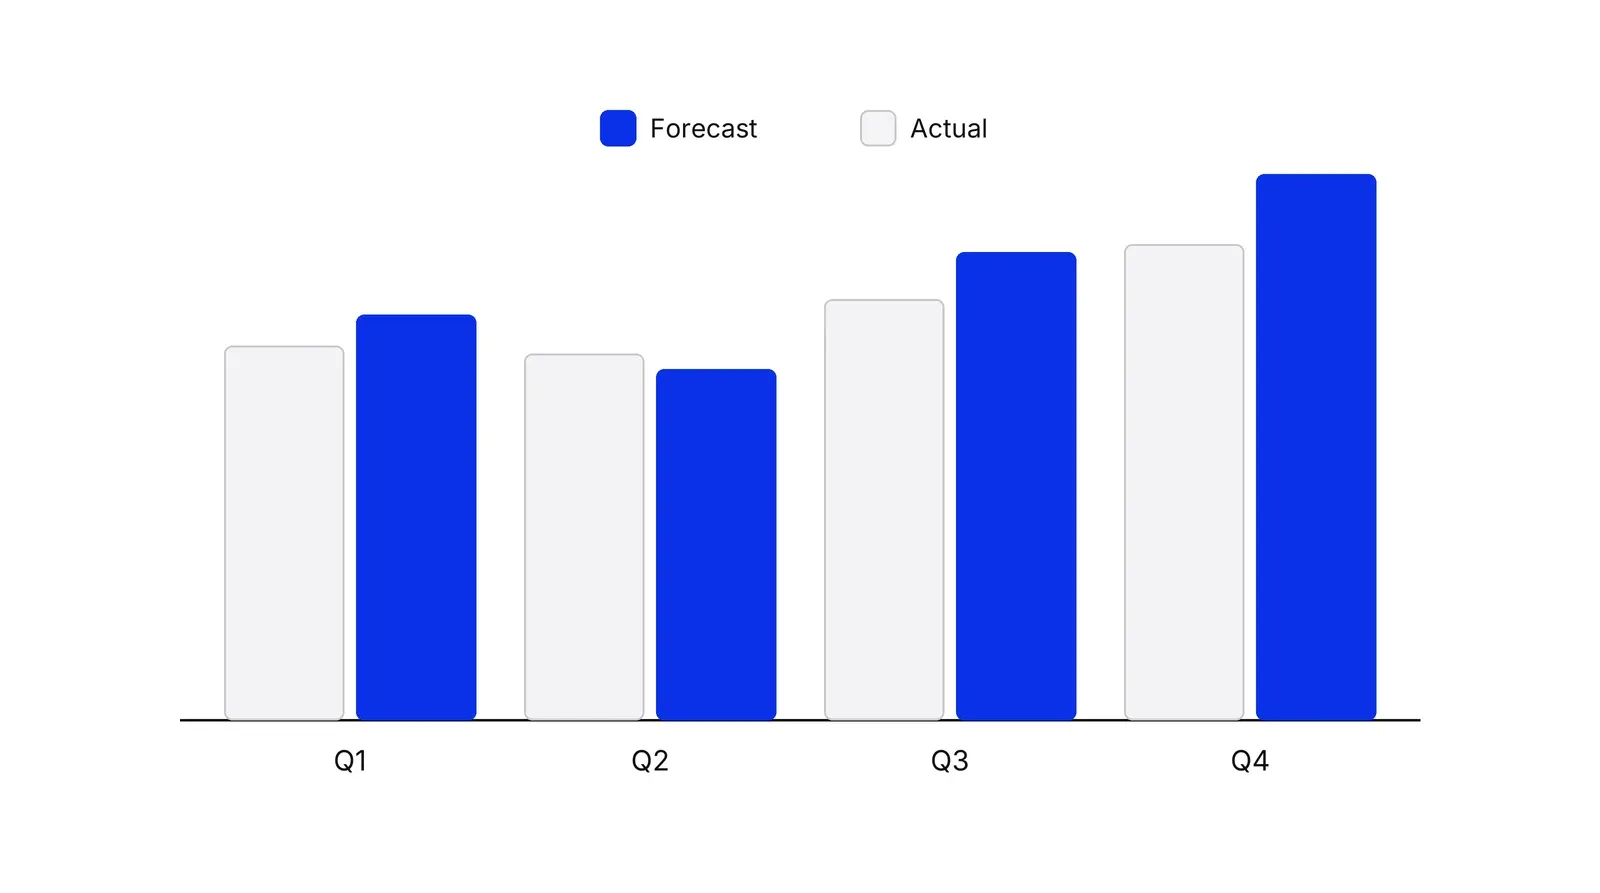
Score on a holdout, not on the fitting data. Hyndman and Athanasopoulos recommend a rolling forecasting origin, where each test uses only the data before it.
Where does it fit?
The forecast is the short-horizon number that revenue operations owns. Sales capacity planning is the longer-horizon counterpart that turns a target into headcount, and scenario planning suits a wide range. A Growth Lab plan starts from a measured error history, because a target set against an unscored forecast rests on guesses.
How to apply Sales forecasting methods, step by step
- Write the question down. Fix the period (this quarter), the measure (new bookings, not revenue recognised) and the moments you forecast (week 1, week 6 and week 11 of the quarter). Result: one sentence that every forecast on the log answers in the same way.
- Build the free baselines. Compute last quarter's bookings, the same quarter last year and a trailing four-quarter average. Result: three run-rate numbers that every other method must beat.
- Measure stage probabilities from history. For deals created in each past quarter, count the share that closed won from each stage, split by segment. Result: a table of real win rates that replaces the percentages typed into the CRM.
- Collect the commit call. Ask reps and managers to sort open deals into categories such as commit, best case and pipeline, and to write one line of evidence per commit deal. Result: a deal-level judgmental forecast with reasons attached.
- Combine and publish a range. Average the weighted pipeline, the run-rate and the commit total, then add a low and a high case from the spread between them. Result: one number with a range, logged with the date.
- Score it after the quarter closes. Compute the error, MAPE and bias for each method and compare them with the run-rate baseline. Result: a ranking of methods by their own record, which sets the weights for next quarter.
Examples
A B2B software team, illustrative
Illustrative numbers in US dollars, no real company. Five open deals total 340k: 80k and 60k at proposal (40%), 120k at negotiation (60%), 50k at demo (20%) and 30k at discovery (10%). The weighted pipeline is 141k. Last quarter's bookings were 120k and the same quarter last year 150k. The managers' commit list adds up to 110k. The team publishes the average of the three, about 130k, with a range of 110k to 150k, and logs it.
A payments company selling to merchants, illustrative
Illustrative numbers, no real company. Deals take about 90 days from first call to signature, and merchants go live four weeks later. A forecast of live volume therefore needs two clocks: the stage-probability forecast for signatures this quarter and a lag table for how many signed merchants start processing before quarter end. Scoring signatures and live volume as two separate forecasts shows which clock is wrong.
A hospital group selling to employers, illustrative
Illustrative numbers in US dollars, no real group. Corporate health plans sell on a nine-month cycle, so a quarter holds only a handful of closings, and a weighted pipeline of 300k can resolve to 0 or 500k. The group forecasts the count of signed contracts as a range, uses the commit call for the two largest deals only, and judges the method by whether actuals land inside the stated range.
When to use it
Use it when leadership sets hiring, spend or targets against a revenue number, when the quarter keeps ending far from the call, or when several people publish different numbers. It fits teams with at least four to six quarters of clean deal history, which is usually a team past its first few dozen deals.
When not to use it
Skip the statistical and stage-probability work when the business has fewer than a few dozen closed deals, since the rates would be noise. Use run-rate plus commit and judge the result against a range. The same applies to a market that just changed, such as a new pricing model, where the past is a weak guide.
Common mistakes
- Typing stage probabilities into the CRM once and never checking them against what actually closed.
- Treating a weighted pipeline as a promise when the quarter holds only a few large deals, so no real outcome is near the weighted figure.
- Letting the person who owns the quota also own the forecast, which mixes a target with a prediction.
- Reporting MAPE alone, which hides a bias where every call is too high.
- Changing the method after a bad quarter without scoring all methods on the same history first.
FAQ
What are the main sales forecasting methods?
Five are common: pipeline-weighted (deal amount times stage probability), stage-probability from measured win rates, historical run-rate, judgmental commit calls from reps and managers, and statistical models such as exponential smoothing. Forecasting research finds that averaging several methods reduces error compared with a typical single method.
Which sales forecasting method is the most accurate?
No method wins everywhere. In the [M4 competition](https://pure.unic.ac.cy/en/publications/the-m4-competition-results-findings-conclusion-and-way-forward/), 12 of the 17 most accurate methods were combinations of mostly statistical approaches, and pure machine learning did poorly. Run each method on your own history, score it against a naive baseline, and weight the combination by the record.
How do you forecast sales with no history, such as a new product?
Use judgment, structured. Forecasting: Principles and Practice says judgmental methods are the main option when no data exist. Take analogies from similar launches, ask several people independently, or run a Delphi panel, and keep a scored log so the next forecast has a record to use.
What is a good MAPE for a sales forecast?
There is no universal threshold, because accuracy depends on deal size and volume. Compare your MAPE with a naive forecast such as last quarter's bookings. If your method does not beat that baseline, it adds no value. Also check bias, the average signed error.
Is sales forecasting the same as demand forecasting?
They overlap but answer different questions. Demand forecasting estimates what customers would buy, while a sales forecast estimates what the team will actually book given capacity, pricing and pipeline. In B2B the deal-level pipeline is the main input to the second.
Sources
- Rob J. Hyndman, George Athanasopoulos, Forecasting: Principles and Practice (3rd ed.), Evaluating point forecast accuracy
- Hyndman, Athanasopoulos, Forecasting: Principles and Practice, Judgmental forecasts
- Hyndman, Athanasopoulos, Forecasting: Principles and Practice, Limitations of judgmental forecasting
- Hyndman, Athanasopoulos, Forecasting: Principles and Practice, Key principles for judgmental forecasting
- Hyndman, Athanasopoulos, Forecasting: Principles and Practice, The Delphi method
- Hyndman, Athanasopoulos, Forecasting: Principles and Practice, Forecasting by analogy
- Hyndman, Athanasopoulos, Forecasting: Principles and Practice, Some simple forecasting methods
- Hyndman, Athanasopoulos, Forecasting: Principles and Practice, Simple exponential smoothing
- Hyndman, Athanasopoulos, Forecasting: Principles and Practice, Forecast combinations
- Hyndman, Athanasopoulos, Forecasting: Principles and Practice, Time series cross-validation
- Hyndman, Athanasopoulos, Forecasting: Principles and Practice, Prediction intervals
- Hyndman, Athanasopoulos, Forecasting: Principles and Practice, Residual diagnostics
- Hyndman, Athanasopoulos, Forecasting: Principles and Practice, What can be forecast?
- J. Scott Armstrong (ed.), Principles of Forecasting: A Handbook for Researchers and Practitioners, Kluwer/Springer, 2001
- J. Scott Armstrong, Combining Forecasts, chapter in Principles of Forecasting, 2001
- Robert T. Clemen, Combining forecasts: A review and annotated bibliography, International Journal of Forecasting 5(4), 1989
- Spyros Makridakis, Michele Hibon, The M3-Competition: results, conclusions and implications, International Journal of Forecasting 16(4), 2000
- Spyros Makridakis, Evangelos Spiliotis, Vassilios Assimakopoulos, The M4 Competition: Results, findings, conclusion and way forward, International Journal of Forecasting 34(4), 2018
- Makridakis, Spiliotis, Assimakopoulos, M5 accuracy competition: Results, findings, and conclusions, International Journal of Forecasting 38(4), 2022
- Makridakis, Spiliotis, Assimakopoulos, The M5 Accuracy competition: Results, findings and conclusions, preprint, October 2020
- Rob J. Hyndman, Anne B. Koehler, Another look at measures of forecast accuracy, International Journal of Forecasting 22(4), 2006
- Robert Fildes, Paul Goodwin, Michael Lawrence, Konstantinos Nikolopoulos, Effective forecasting and judgmental adjustments, International Journal of Forecasting 25(1), 2009
- Michael Lawrence, Paul Goodwin, Marcus O'Connor, Dilek Onkal, Judgmental forecasting: A review of progress over the last 25 years, International Journal of Forecasting 22(3), 2006
- Teresa McCarthy Byrne, Donna Davis, Susan Golicic, John Mentzer, The evolution of sales forecasting management: a 20-year longitudinal study of forecasting practices, Journal of Forecasting 25(5), 2006
- Bent Flyvbjerg, From Nobel Prize to Project Management: Getting Risks Right, Project Management Journal 37(3), 2006
- Dan Lovallo, Daniel Kahneman, Delusions of Success: How Optimism Undermines Executives' Decisions, Harvard Business Review, July 2003
- HubSpot Knowledge Base, Use the forecast tool
Last updated Oct 9, 2026


Marketing agency or growth system: when a company outgrows its agency
An agency is the right call while the founder still runs most of the company. Once the business starts copying itself into new locations or markets, it needs a system that sets goals, tests hypotheses and owns the result.

Why healthcare marketing agencies stall: the short, mid and long wins model we use with clinics
Most agencies own the click and nobody owns the front desk. How we structure clinic work in three horizons, the research behind each one, and one year of results.

How to calculate channel payback and unit economics
A CAC number that only marketing believes will not survive a finance review. This guide calculates channel payback so both teams work from the same model.