North Star Metric
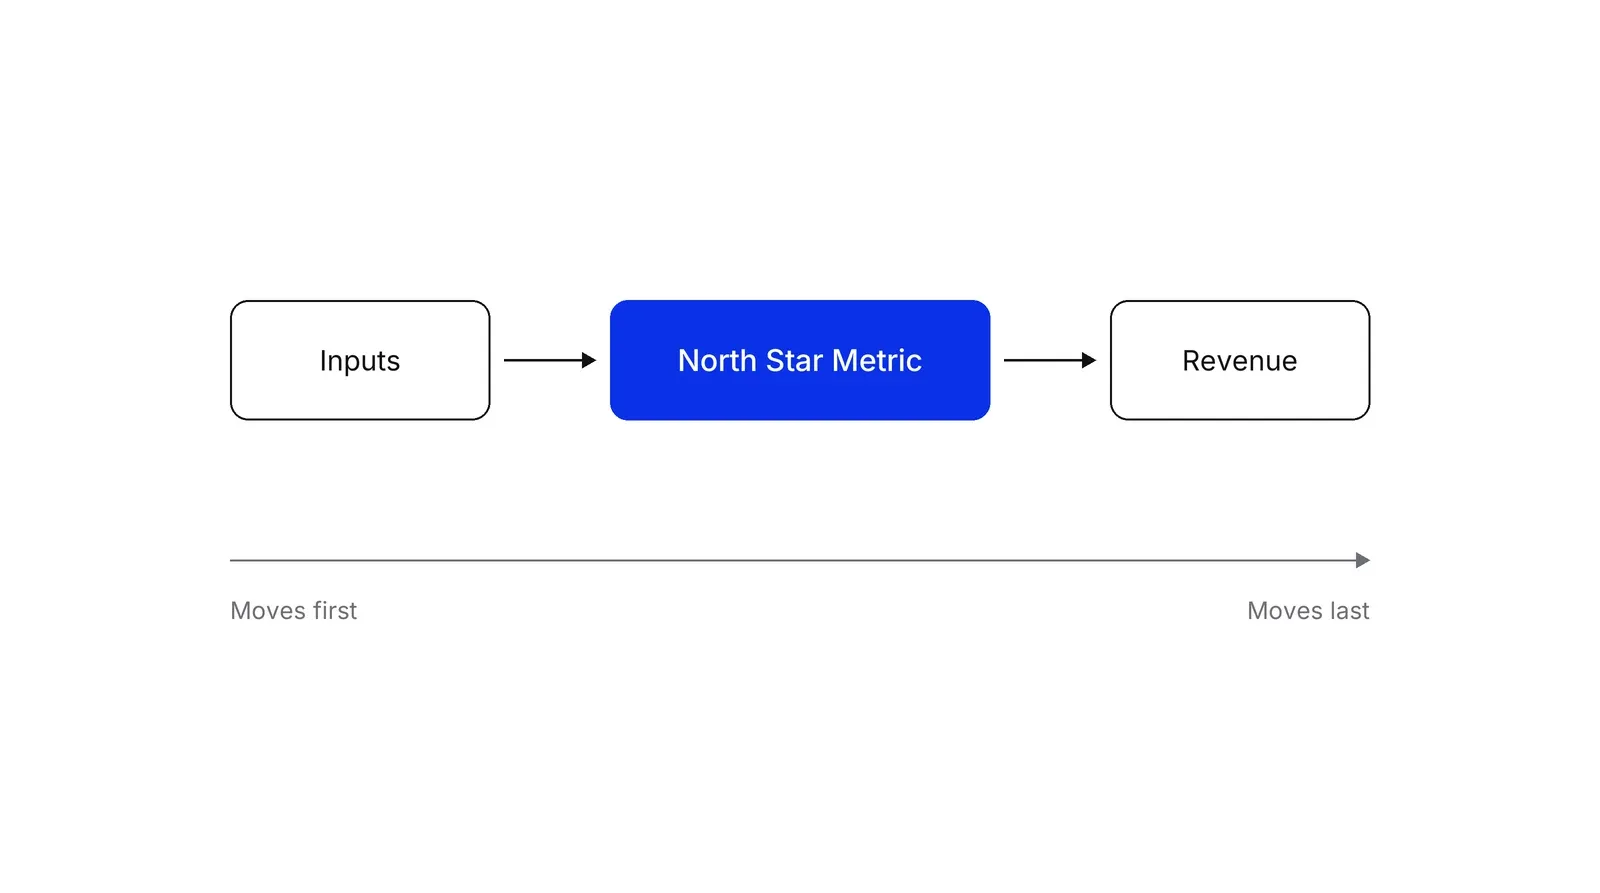
The North Star Metric is the one number that best captures the value customers get from a product, paired with three to five input metrics that teams can move week to week.
A North Star Metric is the single number that best captures the value customers get from a product, chosen so that when it grows, revenue tends to follow. Sean Ellis is credited with popularising the idea, and Amplitude's North Star Framework adds three to five input metrics that teams can move directly, since the North Star itself should sit one step out of reach.
- Origin
- Sean Ellis (popularised the term); John Cutler and Amplitude (North Star Framework), 2010s; playbook 2019
- Level
- 201 · Tool
- Fits
- Startup, Scale-up
- Time to apply
- A half-day workshop for a first draft, then one quarter of data to check it tracks revenue
- What you need
- event data that shows what customers actually do in the product, not only signups and payments · a revenue series long enough to check whether the candidate metric moves before revenue does · the product, marketing and finance leads in one room for the decision
A North Star Metric is the one number that best captures the value customers get from a product. It is picked so that when it grows, revenue tends to grow after it. Teams use it to settle arguments about priorities: a project that cannot plausibly move the North Star, or one of its inputs, waits.
The term came out of the growth-hacking community. Sean Ellis, who also wrote Hacking Growth with Morgan Brown, is the name most often attached to it, and Amplitude credits “Sean Ellis and the growth-hacking community.” Nobody has documented a dated first use. In a 2018 Intercom interview, Ellis described it as “a persistent overall success metric,” as opposed to the short-term metric a team might chase for a few weeks.
Amplitude then turned the idea into a method. Its North Star Playbook, led by product coach John Cutler, appeared around 2019; the launch post promised a next edition for early 2020. The playbook pairs the metric with inputs and workshop exercises, and that pairing is what most teams mean today by the North Star Framework.
What makes a good North Star Metric?
A good North Star Metric passes three tests, according to Amplitude. It represents value the customer actually received. Product and marketing can influence it. And it is a leading indicator of revenue, so it moves before revenue does.
The first test rules out most of the numbers companies already report. Registered users, downloads and page views can all climb while customers get nothing. Ellis gave an example of this in the interview above: a travel marketplace could celebrate app installs that never turn into a booked stay.
The third test rules out revenue itself. Revenue, ARR and average revenue per user are lagging indicators: they record decisions customers already made. A North Star should sit one step earlier.
Which game is your product playing?
Amplitude sorts digital products into three engagement games, and the game tells you what kind of number to count. In the attention game, value is time spent, which suits media and ad-funded apps. In the transaction game, value is purchases or bookings. In the productivity game, value is work done quickly and well, which suits most B2B software.
Amplitude’s advice is to pick one game, even though teams usually say all three matter. Two companies in the same game can still need different metrics: a subscription video service and an ad-funded feed both sell attention, but only one earns more when people watch longer.
Inputs: the part teams can move
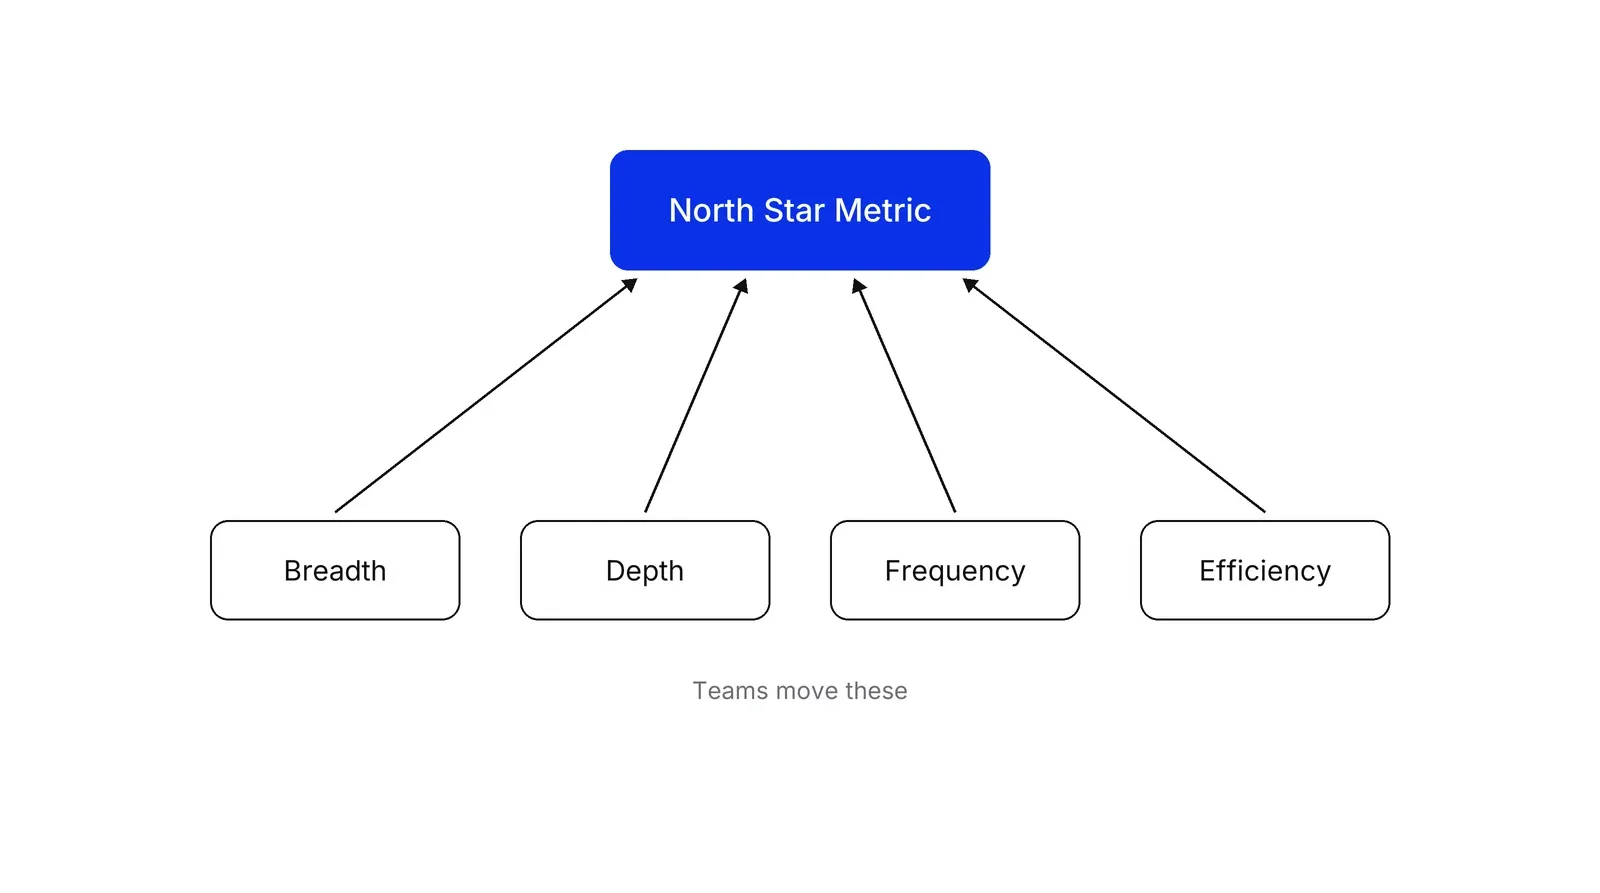
Inputs are three to five factors that together produce the North Star, and that teams can change through their daily work. Cutler puts it bluntly in an Amplitude post: “If you can move your North Star directly, it’s probably not a good North Star.” In his webinar on inputs he adds that, by design, no team should be able to act on a good North Star directly.
Amplitude suggests four prompts for finding inputs: breadth (how many customers get value), depth (how much value each gets), frequency (how often) and efficiency (how fast or reliably). The result is a small tree, the same logic as a KPI tree but anchored on customer value.
Take an illustrative payments app for freelancers whose North Star is payouts delivered on time per month. With 2,000 users making a payout, 3 payouts each and 92% arriving on time, the metric is 5,520. If the product team lifts frequency to 3.5 payouts per user, it becomes 6,440 with nothing else changed. The growth team owns breadth, product owns frequency, operations owns the on-time rate.
What do famous companies actually use?
Fewer verified examples exist than blog posts suggest. Amplitude’s own list of company North Stars (Airbnb, Spotify, Meta, Amazon, Slack, Uber) comes with a warning to treat them “as illustrations rather than official statements.”
| Company | Metric often quoted | What a primary source shows |
|---|---|---|
| Airbnb | Nights booked | Ellis’s example in 2018. The S-1 filing lists Nights and Experiences Booked as a key business metric (326.9 million in 2019) but never calls it a North Star |
| Duolingo | DAU | The company blog calls DAU its top-line KPI; Mazal names current user retention as the Retention Team’s North Star |
| Amplitude | Weekly users who got an answer | First-party, published by Amplitude |
| Seven friends in ten days | Repeated by vendors; no first-party written source found |
Where a single metric goes wrong
One number focuses attention, and it also invites people to game it. Marilyn Strathern’s 1997 paper gave Goodhart’s law its best-known wording: “When a measure becomes a target, it ceases to be a good measure.”
Accounting researchers call the specific failure surrogation: people start treating the measure as if it were the strategy. In experiments by Choi, Hecht and Tayler, surrogation was strongest when pay depended on a single measure. A follow-up study found it fell when managers took part in choosing the strategy, which argues for building the North Star in a workshop, not handing it down. Harris and Tayler made the same case for managers in Harvard Business Review.
Experimentation research reaches a similar conclusion from a different direction. Kohavi and colleagues recommend a single overall evaluation criterion for A/B tests, built from factors that predict long-term goals such as lifetime value and repeat visits, not short-term clicks. The practical rule: pick one number that predicts the long run, and keep its inputs and guardrail metrics on the same dashboard.
At Pushers, the North Star and its inputs sit at the top of the metric tree we build in Growth Lab, and the HADI loops we run each target one of its inputs.
How to apply North Star Metric, step by step
- Name the moment customers get value. Write down the action that means a customer got what they came for: a payout that arrived, a booked appointment that happened, a report someone opened and used. Signups and logins do not count. Result: one sentence describing realised value in the customer's terms.
- Decide which game the product plays. Pick one of Amplitude's three engagement models: attention (time spent), transaction (purchases or bookings) or productivity (work done quickly and well). The game decides what kind of count the North Star should be. Result: one game, agreed by product and the business.
- Write the metric as a count over a time window. Turn the value moment into a number with a unit and a period, such as payouts delivered on time per month. Avoid ratios on their own, because a ratio can rise while the business shrinks. Result: a metric with an exact definition two analysts would compute the same way.
- Check that it leads revenue. Plot the candidate against revenue for the last four to eight quarters. It should move first, and in the same direction. If revenue rose while the candidate fell, the metric is measuring the wrong thing. Result: a chart that either supports the choice or sends you back a step.
- Split it into three to five inputs. Break the metric into factors teams can change directly, using breadth, depth, frequency and efficiency as prompts. Give each input a name, a definition and one owner. Result: a small tree, North Star at the top, inputs underneath, an owner on every box.
- Review it and allow it to change. Read the inputs weekly and the North Star monthly. Revisit the definition when strategy changes; Amplitude says it has changed its own North Star at least three times. Result: a metric that stays tied to the current strategy instead of last year's.
Examples
Duolingo: a North Star for a retention team
Duolingo's data science blog describes daily active users as the company's top-line KPI and breaks DAU into new, current, reactivated and resurrected users. Former product chief Jorge Mazal wrote that the company then created a Retention Team with current user retention rate (CURR) as its North Star metric. He reports that DAU grew 4.5 times over four years from work across product and marketing, while Duolingo's own blog puts the figure at four times since 2019.
Amplitude's own North Star
Amplitude publishes its own example: a weekly active user for whom the platform answered at least one question. The metric counts realised value on a weekly cadence, not logins. Amplitude says it has revised its North Star at least three times as its strategy changed, which is a useful reminder that the metric belongs to a strategy, and changes with it.
A dental clinic group (illustrative)
Illustrative, no real clinic implied. A three-site dental group first tracks booked appointments, which rise every time marketing spends more, while revenue stays flat because many patients never return after the first visit. It switches to treatment plans completed per month. Inputs become new patients examined, share of examined patients who accept a plan, visits per plan and share of visits that happen on the scheduled date. Each input has one owner, from the front desk to the head dentist.
When to use it
Use it once a product has paying or active customers and enough event data to see what they do, and when teams argue about priorities because each one reports a different number. It works best for one product line serving one customer base under one P&L.
When not to use it
Skip it before product-market fit, when you do not yet know which customer action signals value, and in businesses with very few, very large deals, where one contract moves every count. A company running several unrelated products should give each its own North Star instead of forcing one number across all of them.
Common mistakes
- Choosing revenue, ARR or MRR as the North Star. They are lagging indicators: by the time they move, the decisions behind them are months old.
- Picking a number that looks good but says nothing about value, such as registered users, downloads or page views.
- Stopping at the single metric and never defining inputs, so no team knows what to work on on Monday.
- Paying people on the North Star alone. Research on surrogation shows managers start treating a single measure as the strategy itself.
- Copying a famous company's metric from a blog post. Most of the widely quoted examples have no first-party source.
FAQ
What is a North Star Metric?
A North Star Metric is the single number that best captures the value customers get from a product. It is chosen to lead revenue, so that when it grows, revenue tends to follow. Teams do not move it directly. They move three to five input metrics underneath it, and the North Star reflects their combined effect.
Who came up with the North Star Metric?
Growth marketer Sean Ellis is widely credited with popularising the term, and Amplitude credits it to Ellis and the growth-hacking community. No dated first use has been documented. Amplitude's North Star Playbook, led by John Cutler around 2019, turned the idea into a framework with input metrics and workshop exercises.
What is the difference between a North Star Metric and a KPI?
A company tracks many KPIs, and most report how the business performed, like MRR or churn. The North Star is one metric chosen above them because it measures customer value and leads revenue. Inputs sit below it. Operational KPIs stay in place; they just stop competing for the top spot.
Can revenue be a North Star Metric?
Amplitude advises against it. Revenue is a lagging indicator: it records what customers already decided, so teams cannot act on it in time. A good North Star should relate to revenue and move before it does. If the North Star stops predicting revenue, that is the signal to redefine it.
Is nights booked really Airbnb's North Star Metric?
Sean Ellis used nights booked as his Airbnb example in a 2018 interview. Airbnb's 2020 IPO filing lists Nights and Experiences Booked as a key business metric, but it never calls it a North Star. Treat it as a well-known illustration, not a company statement.
Sources
- Inside Intercom podcast, Sean Ellis on charting a path toward sustainable growth, 2018
- Amplitude, Julia Sholtz, What Makes a Good vs Bad North Star Metric, 2024
- Amplitude, Julia Sholtz, Every Product Needs a North Star Metric: Here's How to Find Yours
- Amplitude, John Cutler and Jason Scherschligt, North Star Playbook
- Amplitude, North Star Playbook, About the North Star Framework
- Amplitude, Archana Madhavan, Introducing The North Star Playbook
- Amplitude, John Cutler, Defining Your North Star Inputs and Flywheels (webinar)
- Amplitude, Victoria Rainbolt, The Attention Game, 2019
- Amplitude, Audrey Xu Leung, Leading vs lagging indicators
- Mixpanel, North Star metric guide
- Lenny Rachitsky, Choosing your North Star metric, 2021
- Airbnb, Inc., Form S-1 registration statement, US SEC, 2020
- Duolingo blog, Erin Gustafson, Meaningful metrics: how data sharpened the focus of product teams, 2023
- Jorge Mazal, How Duolingo reignited user growth, Lenny's Newsletter, 2023
- Jongwoon Choi, Gary Hecht, William Tayler, Lost in Translation: The Effects of Incentive Compensation on Strategy Surrogation, The Accounting Review, 2012
- Jongwoon Choi, Gary Hecht, William Tayler, Strategy Selection, Surrogation, and Strategic Performance Measurement Systems, Journal of Accounting Research, 2013
- Harvard Business Review, Michael Harris and Bill Tayler, Don't Let Metrics Undermine Your Business, 2019
- Ron Kohavi, Roger Longbotham, Dan Sommerfield, Randal Henne, Controlled experiments on the web: survey and practical guide, Data Mining and Knowledge Discovery, 2009
- Marilyn Strathern, 'Improving ratings': audit in the British University system, European Review, 1997
- Harvard Business Review, Robert Kaplan and David Norton, The Balanced Scorecard: Measures That Drive Performance, 1992
- Harvard Business Review, Frederick Reichheld, The One Number You Need to Grow, 2003
- Penguin Random House, Sean Ellis and Morgan Brown, Hacking Growth, 2017
Last updated Oct 9, 2026


Marketing agency or growth system: when a company outgrows its agency
An agency is the right call while the founder still runs most of the company. Once the business starts copying itself into new locations or markets, it needs a system that sets goals, tests hypotheses and owns the result.

Why healthcare marketing agencies stall: the short, mid and long wins model we use with clinics
Most agencies own the click and nobody owns the front desk. How we structure clinic work in three horizons, the research behind each one, and one year of results.

Why channel tests stall after month three
Most paid channel tests do not end with a decision. They end when the budget runs out, the attribution model changes, or everyone quietly stops looking at the dashboard.