Predictive churn modeling
Predictive churn modeling uses past customer behavior to estimate who is likely to leave in a set window, so a retention team can decide where to spend its effort before the loss happens.
Predictive churn modeling is the practice of training a statistical or machine learning model on past customer behavior to estimate each customer's chance of leaving within a fixed window, such as 90 days. A retention team uses the ranking to choose whom to contact. Research shows that ranking by risk alone can waste the budget, so the best programs also estimate who the offer actually changes.
- Origin
- No single author; tested in marketing science by Neslin and colleagues, Lemmens and Croux, and Ascarza, Churn tournament published 2006; targeting critique 2018
- Level
- 401 · Expert
- Fits
- Scale-up, Enterprise
- Time to apply
- Four to eight weeks for a first model and a first holdout test, if customer history is already in one table
- What you need
- at least a year of customer records with the date each customer left, saved by date and not overwritten · a clear definition of leaving and a prediction window, for example no renewal within 90 days · a retention action with a known cost per customer, and the ability to hold some customers back from it
Predictive churn modeling is the practice of training a model on past customer behavior to estimate the chance that each customer leaves within a set window. A retention team ranks customers by that chance and spends its budget on the top of the list. The method became a research field in the 2000s, when marketing scientists compared how well different models found churners. A simple score built by hand is covered in customer health score. This page covers the statistical version and the question that follows it: whom to contact.
What does the model predict?
It predicts a yes or no outcome for a fixed period: will this customer leave in the next 90 days? The answer depends on how leaving shows up in your data. In contractual settings such as subscriptions and bank accounts, a cancellation is recorded, so you can label it directly. Ascarza and Hardie build a joint model of usage and renewal for that case, treating both as signs of one hidden state of the customer.
In non-contractual settings, such as a shop or a marketplace, nobody announces leaving. Models like the one by Fader, Hardie and Lee estimate from purchase history whether a customer is still active. In that setting you must also choose a rule, such as 120 days of silence, before you can label anyone as churned.
How is the model built?
Take a past date, called the snapshot date. For every customer, gather what was known on that date, then record whether they left in the window after it. Repeat for several dates and stack the results into one training table.
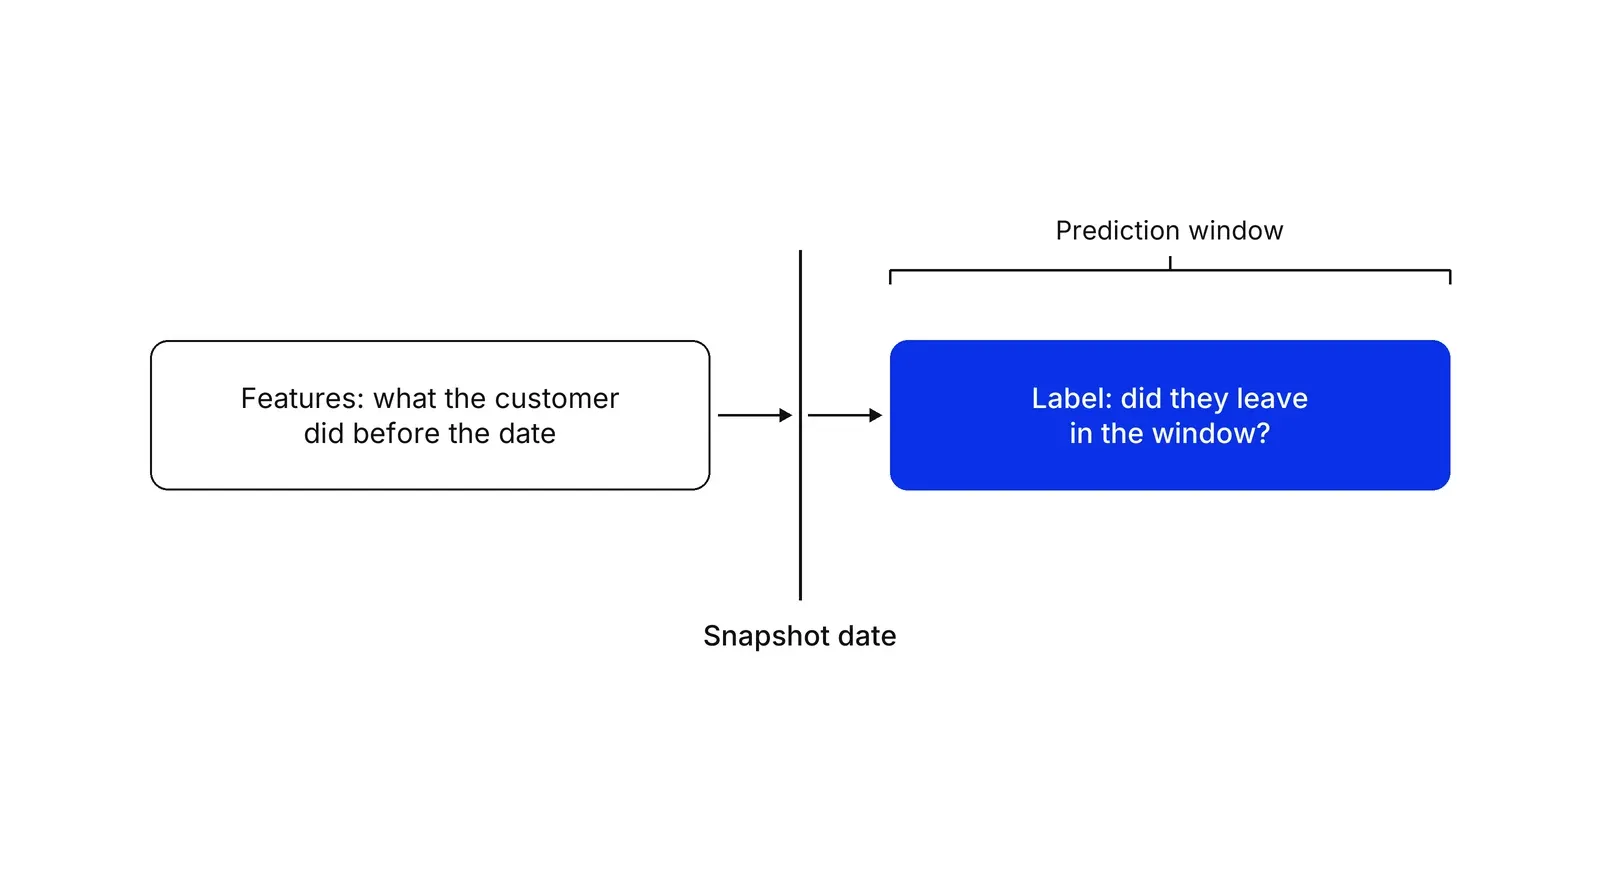
The date discipline matters because of leakage. Kaufman and colleagues define leakage as information about the target that should not be available when the model is used. A “last login” field overwritten after a customer left is a typical case. History length is also a choice: Ballings and Van den Poel study how much customer event history a churn model needs.
Which algorithm should you use?
Start simple and compare. In the churn tournament run by Neslin and colleagues, academics and practitioners fitted models to the same public data. The authors report that methods matter, with differences large enough to change campaign profit by hundreds of thousands of dollars, and that models lose very little accuracy on data compiled three months later.
Lemmens and Croux found that bagging and boosting of classification trees significantly improved churn prediction at a US wireless carrier. They also recommend balanced sampling for rare events, with a bias correction. Boosted trees remain a standard choice, for example through XGBoost. Verbeke, Martens and Baesens add social network analysis, which uses the links between customers as extra input, and survival analysis handles customers who have not left yet.
How do you know the model is good?
Judge it on a later period and by what the decision is worth. Shuffled splits mix near-in-time rows into training and test sets and inflate results, which the scikit-learn guide warns about, so test forward in time.
Churn is rare, so accuracy misleads. The area under the ROC curve is, per Hanley and McNeil, the chance that a random churner is ranked above a random stayer. Saito and Rehmsmeier argue precision and recall say more on imbalanced data. Probabilities should also be calibrated: of customers scored 30%, about 30% should leave.
The deeper test is money. Verbeke and colleagues frame churn prediction as a profit-driven problem, and Lemmens and Gupta propose optimizing the profit of retention campaigns with a machine learning approach to causal inference. A ranking is only worth what the campaign earns from the group you can afford to contact.
Should you target by risk or by uplift?
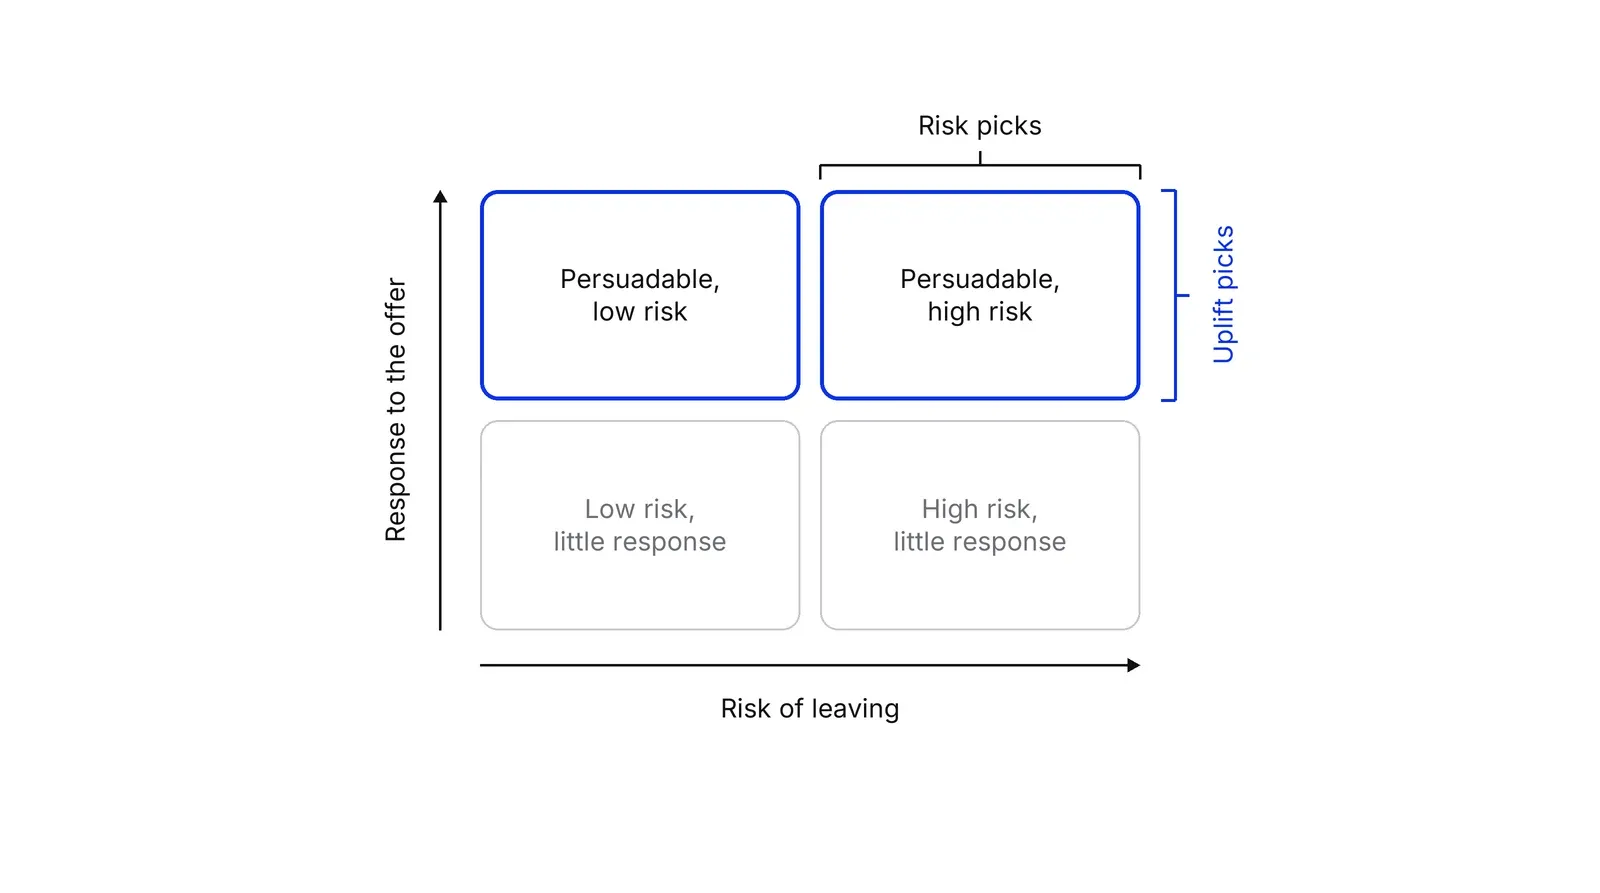
Targeting by risk means contacting the customers most likely to leave. Targeting by uplift means contacting those whose chance of leaving the offer changes most. They are different lists. Ascarza’s field experiments showed that the highest-risk customers are not necessarily the best targets, and that firms should target on sensitivity to the intervention, regardless of risk.
| Targeting by risk | Targeting by uplift | |
|---|---|---|
| Question answered | Who will probably leave? | Whom does the offer change? |
| Training data | Past behavior and outcomes | A randomized test of the action |
| Typical waste | Contacting customers already gone or unmoved | Needs an experiment first |
| Evaluation | AUC, precision, calibration | Qini and uplift curves |
Uplift modeling has its own literature. Rzepakowski and Jaroszewicz model the change in class probability caused by an action. Gutierrez and Gérardy review the main approaches, and Wager and Athey and Künzel and colleagues offer causal forests and metalearners. Treat the results with care: Devriendt, Moldovan and Verbeke found uplift random forests among the best performers on Qini and Gini measures, yet uplift models were often unstable across cross-validation folds. Hitsch, Misra and Zhang study how to evaluate targeting policies built on such estimates, and the review by Ascarza and colleagues surveys retention management more broadly.
The data for an uplift model must come from a randomized test, as described in incrementality testing. The scores then feed next best action decisions, while win-back campaigns handle customers already gone. Read results by signup group with cohort analysis, and track the outcome through net revenue retention. A Growth Lab plan starts from a model that has been tested forward in time and an action that has been tested against a holdout.
How to apply Predictive churn modeling, step by step
- Define churn and the window. Write down what counts as leaving: a cancelled plan, a lapsed contract, 120 days without a purchase. Pick the window the model predicts, such as the next 90 days. Result: one sentence that decides the label for every customer.
- Build snapshots. For each of several past dates, collect what was known about every customer on that date and mark whether they left in the window after it. Use only information that existed on the date. Result: a table of customer, date, features and label, with nothing from the future.
- Fit a simple model first. Start with logistic regression or a single decision tree, then compare a boosted-tree model. Keep whichever wins on a later period that the model never saw. Result: a baseline score and a challenger, each with a stated test period.
- Judge it by money. Rank customers by score, take the top group you could afford to contact, and compute caught churners, cost of contact and value of customers saved. Result: an expected profit per campaign size, not just an accuracy figure.
- Test the action on a holdout. Split the contacted group at random: some receive the retention action and some receive nothing. Compare churn between the two. Result: a measured effect of the action, overall and by risk band.
- Move from risk to uplift. Fit a second model on the experiment data that predicts the change in churn caused by the action, then rank by that change. Retest on a fresh holdout. Result: a target list built on response instead of risk.
Examples
A subscription app
Illustrative arithmetic. An app has 10,000 subscribers and 5% leave within 90 days, so 500 churners. The model's top decile, 1,000 subscribers, holds 250 of them. A retention offer costs 15 per contact and saves a subscriber worth 300. If the offer cuts churn by 2 points in the riskiest 1,000, it saves 20 and loses money: 6,000 gained against 15,000 spent. If a response model finds 1,000 subscribers where it cuts churn by 8 points, it saves 80: 24,000 against 15,000.
A retail bank's current accounts
Illustrative. A bank flags customers whose salary stopped arriving and whose card use fell. The model scores them, but the first holdout shows the highest-scoring customers had already moved their main account and ignore the call. The team moves the action earlier, to customers in the middle of the score range, where the call changes the outcome.
A clinic network's memberships
Illustrative. A healthcare provider sells annual memberships and predicts non-renewal 60 days before expiry from visits, missed appointments and app use. The retention action is a free preventive check. A holdout compares members who receive an invitation with those who do not, so the clinic learns whether the check saves memberships or only reaches members who would have renewed.
When to use it
Use it when you have many customers, a few years of dated history, a clear moment when customers leave, and a retention action with a real cost. It fits subscriptions, banking, telecom, insurance and memberships, where leaving is recorded and a campaign can reach people before it happens.
When not to use it
Skip it with a few hundred customers, where an account manager knows who is unhappy, or when there are too few past churners to learn from. Skip it when you cannot act on the output: a prediction without a retention action only produces a report. For first-time buyers who never return, use RFM or cohort analysis.
Common mistakes
- Calling the highest-risk customers the best targets. Ascarza's field experiments found they are not necessarily the ones a retention program changes.
- Leaking the future into the features. A field overwritten after a customer left, such as last login, makes a backtest look better than the live model will be.
- Judging the model by accuracy alone. With rare churn, a model that predicts nobody leaves is highly accurate and useless, so judge by profit at the campaign size you can afford.
- Skipping the holdout. Without customers who receive no action, you cannot tell saved customers from those who would have stayed anyway.
- Training once and never retesting. Behavior shifts with pricing, product and season, so rescore a recent period on a schedule.
FAQ
How do you predict customer churn?
Pick a past date, record what each customer had done up to it, and mark who left in the following window, such as 90 days. Train a model on many such snapshots, then test it on a later period. The model returns a probability per customer, which you rank.
Which model is best for churn prediction?
No model wins everywhere. In the 2006 churn tournament, methods and how teams built them changed campaign profit by hundreds of thousands of dollars. Lemmens and Croux found bagging and boosting trees improved accuracy at one carrier. Start with a simple model, then compare boosted trees on a later period.
How accurate does a churn model need to be?
Accuracy is the wrong yardstick because churn is rare. Check how many churners the top slice you can contact catches, how well the probabilities are calibrated, and the profit of the campaign. A modest model that targets the right people can beat a better ranking aimed at the wrong ones.
How is churn prediction used in banking and telecom?
Both have recorded leaving, rich behavior data and a retention offer, so they are the classic settings. Verbeke and colleagues' profit-driven study and the Lemmens and Croux work both concern telecom. A bank uses the same snapshot method, with signals like salary inflows and card use instead of call minutes.
What is the difference between churn prediction and uplift modeling?
Churn prediction estimates who is likely to leave. Uplift modeling estimates how much a specific action changes the chance of leaving for each customer. A customer can be at high risk and unmoved by the offer, so uplift ranks by response rather than risk.
Sources
- Scott A. Neslin, Sunil Gupta, Wagner Kamakura, Junxiang Lu, Charlotte Mason, Defection detection: measuring and understanding the predictive accuracy of customer churn models, Journal of Marketing Research 43(2), 2006
- Aurélie Lemmens, Christophe Croux, Bagging and boosting classification trees to predict churn, Journal of Marketing Research 43(2), 2006
- Eva Ascarza, Retention futility: targeting high-risk customers might be ineffective, Journal of Marketing Research 55(1), 2018
- Wouter Verbeke, Karel Dejaeger, David Martens, Joon Hur, Bart Baesens, New insights into churn prediction in the telecommunication sector: a profit driven data mining approach, European Journal of Operational Research 218(1), 2012
- Aurélie Lemmens, Sunil Gupta, Managing churn to maximize profits, Marketing Science 39(5), 2020
- Eva Ascarza, Scott A. Neslin, Oded Netzer, Zachery Anderson, Peter S. Fader, Sunil Gupta and others, In pursuit of enhanced customer retention management: review, key issues, and future directions, Customer Needs and Solutions 5, 2018
- Eva Ascarza, Bruce G. S. Hardie, A joint model of usage and churn in contractual settings, Marketing Science 32(4), 2013
- Peter S. Fader, Bruce G. S. Hardie, Ka Lok Lee, Counting your customers the easy way: an alternative to the Pareto/NBD model, Marketing Science 24(2), 2005
- Piotr Rzepakowski, Szymon Jaroszewicz, Decision trees for uplift modeling with single and multiple treatments, Knowledge and Information Systems 32(2), 2012
- Floris Devriendt, Darie Moldovan, Wouter Verbeke, A literature survey and experimental evaluation of the state-of-the-art in uplift modeling, Big Data 6(1), 2018
- Pierre Gutierrez, Jean-Yves Gérardy, Causal inference and uplift modelling: a review of the literature, Proceedings of Machine Learning Research 67, 2017
- Stefan Wager, Susan Athey, Estimation and inference of heterogeneous treatment effects using random forests, Journal of the American Statistical Association 113(523), 2018
- Sören R. Künzel, Jasjeet S. Sekhon, Peter J. Bickel, Bin Yu, Metalearners for estimating heterogeneous treatment effects using machine learning, PNAS 116(10), 2019
- Günter J. Hitsch, Sanjog Misra, Walter W. Zhang, Heterogeneous treatment effects and optimal targeting policy evaluation, Quantitative Marketing and Economics 22(2), 2024
- Wouter Verbeke, David Martens, Bart Baesens, Social network analysis for customer churn prediction, Applied Soft Computing 14, 2014
- Michel Ballings, Dirk Van den Poel, Customer event history for churn prediction: how long is long enough?, Expert Systems with Applications 39(18), 2012
- Tianqi Chen, Carlos Guestrin, XGBoost: a scalable tree boosting system, Proceedings of the 22nd ACM SIGKDD Conference, 2016
- Shachar Kaufman, Saharon Rosset, Claudia Perlich, Ori Stitelman, Leakage in data mining, ACM Transactions on Knowledge Discovery from Data 6(4), 2012
- Takaya Saito, Marc Rehmsmeier, The precision-recall plot is more informative than the ROC plot when evaluating binary classifiers on imbalanced datasets, PLOS ONE, 2015
- James A. Hanley, Barbara J. McNeil, The meaning and use of the area under a receiver operating characteristic (ROC) curve, Radiology 143(1), 1982
- scikit-learn documentation, Probability calibration
- scikit-learn documentation, Cross-validation: evaluating estimator performance
- scikit-learn documentation, Metrics and scoring: quantifying the quality of predictions
- lifelines documentation, Introduction to survival analysis
Last updated Oct 9, 2026


Marketing agency or growth system: when a company outgrows its agency
An agency is the right call while the founder still runs most of the company. Once the business starts copying itself into new locations or markets, it needs a system that sets goals, tests hypotheses and owns the result.

Why healthcare marketing agencies stall: the short, mid and long wins model we use with clinics
Most agencies own the click and nobody owns the front desk. How we structure clinic work in three horizons, the research behind each one, and one year of results.

Why channel tests stall after month three
Most paid channel tests do not end with a decision. They end when the budget runs out, the attribution model changes, or everyone quietly stops looking at the dashboard.