Service blueprint
A service blueprint maps one service from the customer's side and the organization's side in a single diagram, so a team can see which hidden step causes a problem the customer feels.
A service blueprint is a diagram that maps a service from the customer's side and the organization's side at once. Rows show customer actions, frontstage actions, backstage actions, support processes and physical evidence, split by lines of interaction, visibility and internal interaction. G. Lynn Shostack introduced it in the early 1980s to find where a service fails.
- Origin
- G. Lynn Shostack (1982, 1984); lines and layers developed by Kingman-Brundage and by Bitner, Ostrom and Morgan, 1982; 1984; 2008
- Level
- 201 · Tool
- Fits
- Small and mid-size, Scale-up, Enterprise
- Time to apply
- half a day for a concept blueprint of one journey; one to two weeks with interviews and cross-team review
- What you need
- one customer journey, already scoped to one customer type · people from frontstage, backstage and support who know how the work really runs · support tickets, complaints or a journey map showing where customers feel friction
A service blueprint is a diagram of one service that shows, in a single picture, what the customer does and the work the organization does to make it happen, most of which the customer never sees. Teams use it when a problem shows up in one place and nobody agrees where it starts.
Where it came from
G. Lynn Shostack introduced the term. Her 1982 article “How to Design a Service” in the European Journal of Marketing argued that rational service design starts with a way to visualize the service, and it is the earliest source for the name. Her 1984 Harvard Business Review article, “Designing Services That Deliver,” reached managers. Shostack was then a senior vice president at Bankers Trust, and the piece opens with everyday service failures such as an ATM that swallows a card.
Margrethe Haugen’s review of the method’s history summarizes the 1984 recipe in four steps: identify the process, isolate the fail points, establish a time frame and analyze profitability. The same review credits Kingman-Brundage with adding the layers and the lines between them; sources date her work to 1988 or 1989. The version most teams use now is Bitner, Ostrom and Morgan’s 2008 article in California Management Review. They note that early blueprints were a process control technique, and that onstage and backstage activity and physical evidence were added later.
The five rows
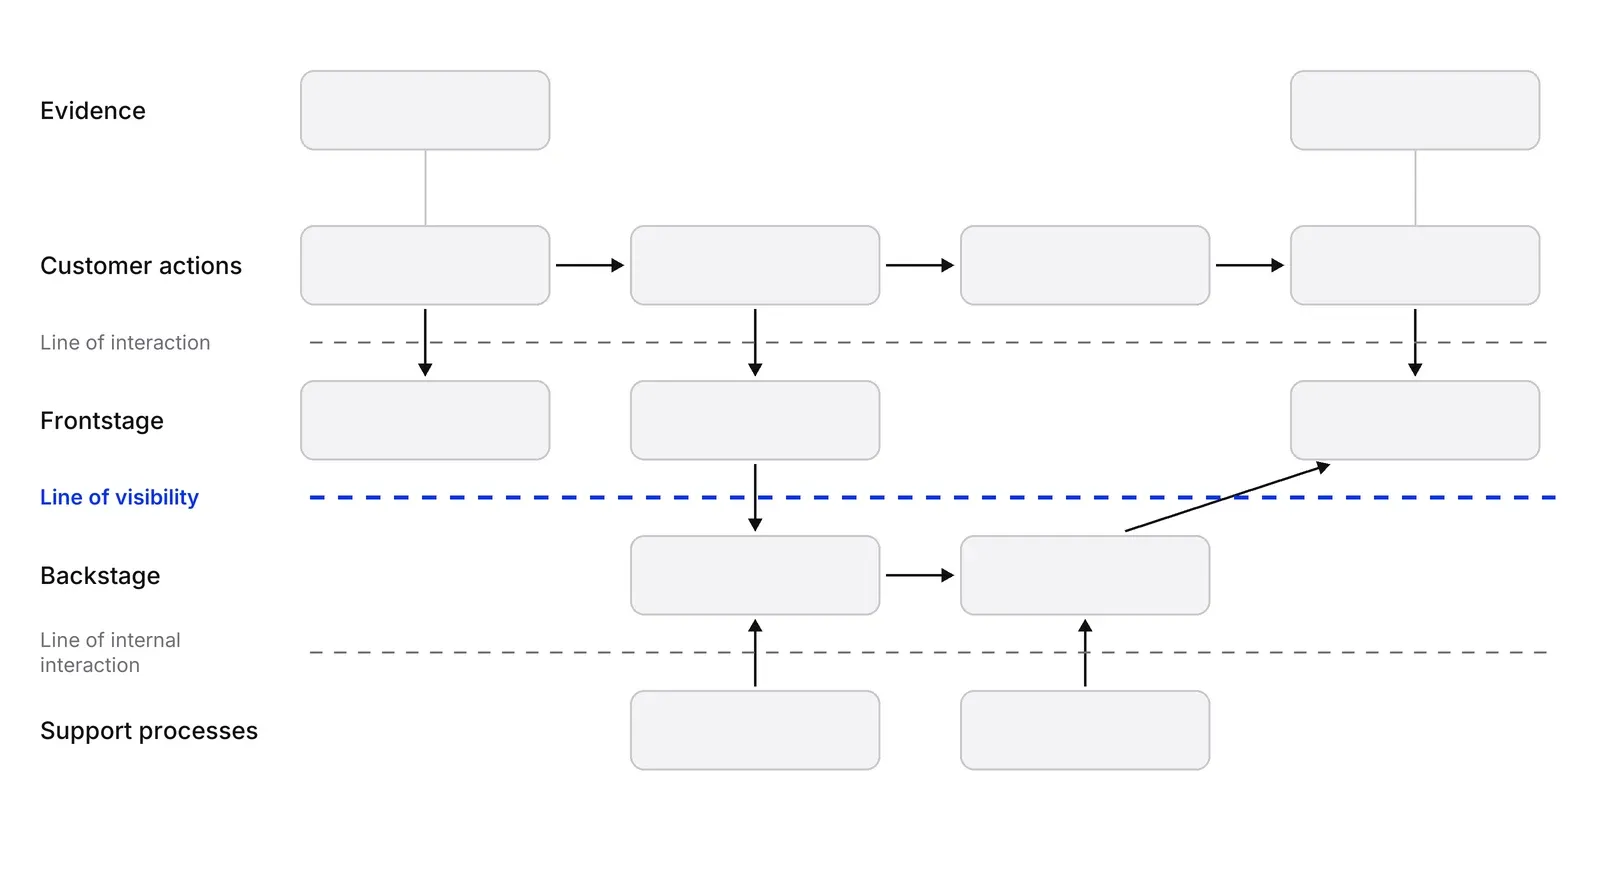
A blueprint has five rows, read from the customer down into the organization. Nielsen Norman Group lists them as customer actions, frontstage actions, backstage actions, processes and evidence.
- Customer actions are the steps and choices the customer makes. They come first, and everything else hangs from them.
- Frontstage actions are what staff or software do in view of the customer: the receptionist, the booking screen.
- Backstage actions are the work that supports the front, out of view: finding a record, checking insurance.
- Support processes are the systems, teams and rules that let backstage staff do their work.
- Evidence is what the customer can see or touch at each step, from a confirmation email to a waiting room.
Three lines separate them. The line of interaction marks direct contact between customer and organization. The line of visibility separates what the customer can see from what they cannot. The line of internal interaction separates contact staff from the people and systems that do not deal with customers at all.
What it finds that other diagrams miss
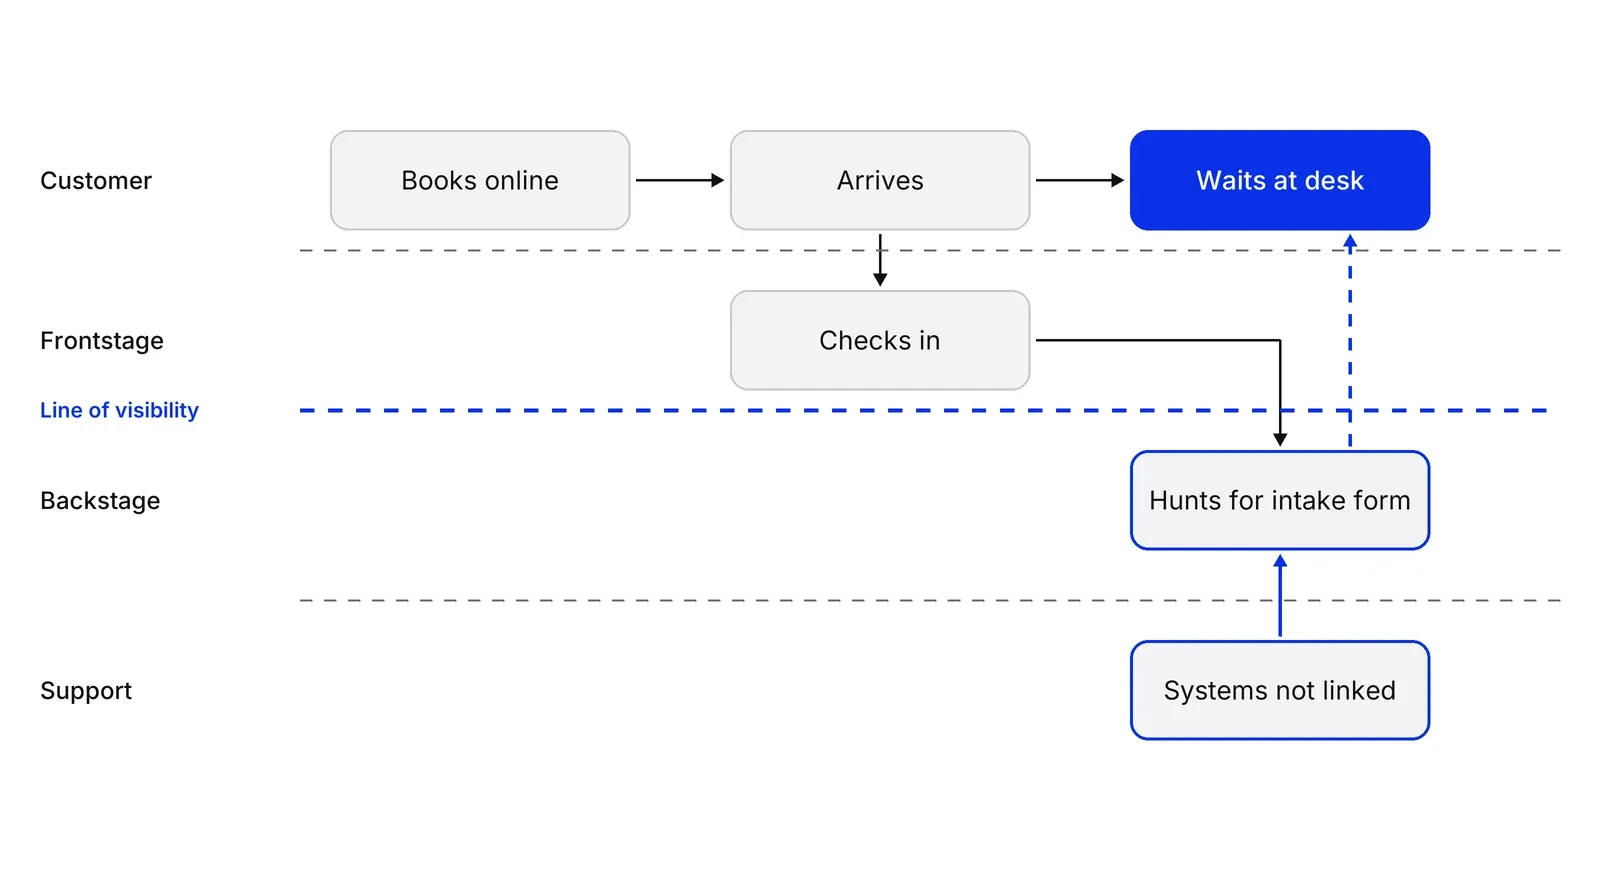
The row that matters most is the one the customer cannot see. In the clinic example, the customer feels a wait at the desk, but the cause sits in the support row, in systems that do not talk to each other. A journey map would record the frustration, and the blueprint traces it to its source.
This is the reason for the method. Katherine Lemon and Peter Verhoef’s review describes customers meeting firms through many touchpoints across channels, and a McKinsey article in HBR warned that polishing each moment can give a distorted picture of the whole journey. A blueprint adds the missing layer: who does what, in what order, behind each moment.
Research on experience design points the same way. Zomerdijk and Voss found strong support for designing journeys and touchpoints, and flagged coupling backstage staff with frontstage activity as an emerging frontier.
Blueprint, journey map and process map
| Journey map | Service blueprint | BPMN process map | |
|---|---|---|---|
| Point of view | The customer’s | Customer and organization | The process’s |
| Shows | Actions, thoughts, feelings | Customer steps plus frontstage, backstage and support | Events, activities, decisions, who does what |
| Best for | Finding where the experience hurts | Finding which hidden step causes it | Specifying a process in detail or for software |
| Level of detail | Phases | Steps across layers | Every task and branch |
The relationship between the first two is sequential. Nielsen Norman Group calls blueprints extensions of journey maps, so start with the customer journey map and add the organization’s layers. Halvorsrud and colleagues put it the same way: a blueprint shows what an organization plans for a customer, while journeys show what happens from the customer’s side.
BPMN goes deeper on one process. Bitner and colleagues say blueprinting is simpler and less formal, and that a blueprint can link to BPMN diagrams for the detailed sub-processes. The Object Management Group published BPMN 2.0 in December 2010.
In healthcare and beyond
Healthcare took to the family of methods quickly. A 2023 scoping review found 81 articles on patient journey mapping, 76.5 percent of them since 2015. The Institute for Healthcare Improvement offers a flowchart tool that helps teams spot delays, duplication and communication breakdowns, which are the same things a blueprint exposes with more layers.
The Urip Sumoharjo outpatient study shows the pattern in practice: blueprinting located long waits, an unintegrated queue and weak coordination between departments, causes that sit in coordination and systems more than at the front desk.
How to keep it useful
Bitner and colleagues give practical rules: map the service as it happens most of the time, involve people from every group that delivers it, and note disagreements, because they usually mark problem areas. They also say the blueprint must be updated or it stops being accurate.
Nielsen Norman Group’s research adds the common failure. In a survey of 97 UX professionals the top frustrations were setting expectations, scoping and communicating insights, and fewer than half of surveyed organizations involved senior leaders, support, marketing or sales. Pair the blueprint with a measure at each fail point, such as the CSAT and CES scores right after the step, so a fix can be checked.
A Growth Lab plan starts from a blueprint like this one, so each change targets a known fail point.
How to apply Service blueprint, step by step
- Pick one service and one customer segment. Name the process and who it serves, for example a first visit for a new patient. Bitner, Ostrom and Morgan stress that segments often get different processes, so one blueprint covers one segment. Result: a one-line scope.
- Write the customer actions first. Lay out what the customer does, left to right, from their own start to their own end. Settle when the service starts and stops from their point of view. Result: a row of customer steps in time order.
- Add frontstage, then backstage actions. Under each customer step, place what staff do in view of the customer, then what staff do out of view. Draw the line of visibility between them. Result: every customer step linked to the people behind it.
- Add the support processes. Below the backstage row, list the systems, teams and rules that make those actions possible, such as the booking system or the records archive. Result: a row that names what each backstage step depends on.
- Add evidence and mark the fail points. Place what the customer can see or touch at each step, from a booking screen to a waiting room. Then mark the steps where things go wrong and add time. Result: a list of fail points tied to a cause.
- Turn each fail point into an owner and a change. Take the worst two or three fail points, trace each to the layer that causes it, and give each one an owner and a date. Result: a short change list, not a poster.
Examples
A clinic's first visit
Illustrative. A clinic sees 400 first visits a month. Patients complain about waiting at the front desk, and the desk is blamed. The blueprint shows the wait starts backstage: the online booking tool and the records system are not linked, so staff hunt for each intake form. At six minutes a form, that is 40 hours a month. The fix is an integration, not a bigger desk.
A hospital outpatient department
Documented. A 2025 qualitative study of an outpatient department at Urip Sumoharjo Hospital in Indonesia used service blueprinting with observation and interviews. It found long waits, an unintegrated queuing system and weak coordination between departments, and proposed appointment-based flow and digital registration.
A fintech account opening
Illustrative. A neobank sees applicants stall after submitting identity documents. The blueprint puts manual document review in the backstage row and shows that the applicant sees nothing for a day. The change is a visible status message plus a faster review queue, found by looking at the row the customer cannot see.
When to use it
Use it when customers feel a problem in one place and the cause is probably elsewhere, when several teams must change one service together, or when you are designing a new service and need to cost the backstage work before launch.
When not to use it
Skip it for a single-step interaction with no handoffs, or when nobody has yet studied what customers do. Build a journey map first. Skip it too when the goal is only to document a process for software, where BPMN fits better.
Common mistakes
- Starting with the internal process and forgetting the customer, so the diagram describes the organization instead of the service.
- Drawing the ideal process instead of how the service runs most of the time, which hides the fail points.
- Building it with one team in a room. Frontstage, backstage and support each know a different part of the truth.
- Making it so detailed that nobody can read it, instead of a concept blueprint that fits on one wall.
- Finishing the diagram and stopping, with no owner, no date and no re-check after the fix.
FAQ
What is a service blueprint?
A service blueprint is a diagram of one service that shows what the customer does, what staff do in view of the customer, what staff do out of view and which systems support all of it. Lines separate the layers. It is used to find where a service fails and which hidden step causes it.
What is the difference between a service blueprint and a customer journey map?
A journey map shows the customer's own view: actions, thoughts and feelings. A service blueprint keeps the customer actions and adds the organization's frontstage, backstage and support work behind them. Nielsen Norman Group calls the blueprint a sequel to the journey map, so build the journey map first.
What is the line of visibility?
The line of visibility is the line in a service blueprint that separates what the customer can see from what they cannot. Everything above it is onstage, such as a receptionist or a booking screen. Everything below it is backstage, such as records lookup or insurance checks. Many fail points sit just below it.
Who invented the service blueprint?
G. Lynn Shostack. Her 1982 article in the European Journal of Marketing introduced the term, and her 1984 Harvard Business Review article popularized it. The lines of interaction, visibility and internal interaction came later, from Kingman-Brundage's work in the late 1980s, and Bitner, Ostrom and Morgan formalized the modern five-layer form with a 2008 article.
Sources
- G. Lynn Shostack, Designing Services That Deliver, Harvard Business Review, January 1984
- G. Lynn Shostack, How to Design a Service, European Journal of Marketing 16(1), 1982
- G. Lynn Shostack, Service Positioning Through Structural Change, Journal of Marketing 51(1), 1987
- Mary Jo Bitner, Amy L. Ostrom, Felicia N. Morgan, Service Blueprinting: A Practical Technique for Service Innovation, California Management Review 50(3), 2008
- Nielsen Norman Group, Service Blueprints: Definition
- Nielsen Norman Group, Service Blueprinting FAQ
- Nielsen Norman Group, Overcoming Service-Blueprinting Frustrations
- Nielsen Norman Group, Journey Mapping 101
- Margrethe Haugen, Service blueprints: Persistent qualities and future potential, Norwegian University of Science and Technology
- Lia Patricio, Raymond P. Fisk, Joao Falcao e Cunha, Designing Multi-Interface Service Experiences: The Service Experience Blueprint, Journal of Service Research 10(4), 2008
- Ragnhild Halvorsrud, Knut Kvale, Asbjorn Folstad, Improving Service Quality through Customer Journey Analysis, Journal of Service Theory and Practice 26(6), 2016
- Leonieke Zomerdijk, Christopher Voss, Service Design for Experience-Centric Services, London Business School working paper, 2010
- Katherine N. Lemon, Peter C. Verhoef, Understanding Customer Experience Throughout the Customer Journey, Journal of Marketing 80(6), 2016
- Alex Rawson, Ewan Duncan, Conor Jones, The Truth About Customer Experience, Harvard Business Review, September 2013
- Richard B. Chase, Where Does the Customer Fit in a Service Operation?, Harvard Business Review, November 1978
- A. Parasuraman, Valarie Zeithaml, Leonard Berry, A Conceptual Model of Service Quality and Its Implications for Future Research, Journal of Marketing 49(4), 1985
- Matthew Dixon, Karen Freeman, Nick Toman, Stop Trying to Delight Your Customers, Harvard Business Review, July 2010
- Susi Indriyani, Dwi Nurahman, Improving Outpatient Service Quality at Urip Sumoharjo Hospital in Bandar Lampung, Asian Journal of Islamic Economics and Business 3(2), 2025
- Reporting and conducting patient journey mapping research in healthcare: A scoping review, Journal of Advanced Nursing, 2023
- Institute for Healthcare Improvement, Flowchart
- Object Management Group, Business Process Model and Notation (BPMN) version 2.0
Last updated Oct 9, 2026


Fractional COO or embedded operations team? How to choose at Series A
The two models solve different problems: how to tell which one your company needs, and what each costs in time and control.
What operational systems successful fintech startups use: lessons from ten companies
Starling, Monzo, Qonto, bunq, Lunar, Pleo, Tide, Ramp, Mercury and Column scaled on four operating systems. Regulators' findings show what breaks when one of them lags behind growth.

What a revenue operations manager actually owns
Pipeline definitions, CRM hygiene, forecasting and the handoffs between marketing, sales and success. What the role covers, and how it differs from sales ops.