CAC payback period
CAC payback period is the number of months of gross profit from a new customer needed to earn back what it cost to win them.
CAC payback period is the number of months it takes a new customer's gross profit to repay the cost of acquiring them. The formula is customer acquisition cost divided by monthly revenue per customer times gross margin. Founders use it to judge how fast growth spending returns cash, and how much funding a growth plan needs.
- Origin
- SaaS investor and operator practice; no single originator, practice-based; benchmark datasets used here run from 2010 to 2025
- Level
- 201 · Tool
- Fits
- Startup, Scale-up
- Time to apply
- Half a day if spend and new-customer data are already tracked by month
- What you need
- sales and marketing spend for a period, fully loaded (salaries, tools, ads, commissions) · the number of new customers won, or new recurring revenue from them, in the same window · average monthly revenue per customer and your gross margin
CAC payback period is the number of months a new customer’s gross profit takes to repay the cost of winning them. Customer acquisition cost (CAC) is what you spend on sales and marketing per new customer. Payback answers a cash question: how long is that money out of the bank before the customer returns it?
No single person invented the metric. It grew out of subscription-software investing, where a customer’s revenue arrives monthly and the acquisition bill arrives upfront. David Skok’s widely read SaaS metrics essay frames months to recover CAC as a measure of capital efficiency, and Bessemer Venture Partners uses it as a standard check on cloud companies. The idea is older and more general: finance has long measured how fast an investment returns its cost, and CAC payback applies that to one customer.
The formula
Payback in months equals CAC divided by monthly revenue per customer multiplied by gross margin. CAC is sales and marketing spend divided by new customers. Gross margin is revenue minus the direct cost of delivering the service, as a share of revenue. ChartMogul and Corporate Finance Institute give the same structure.
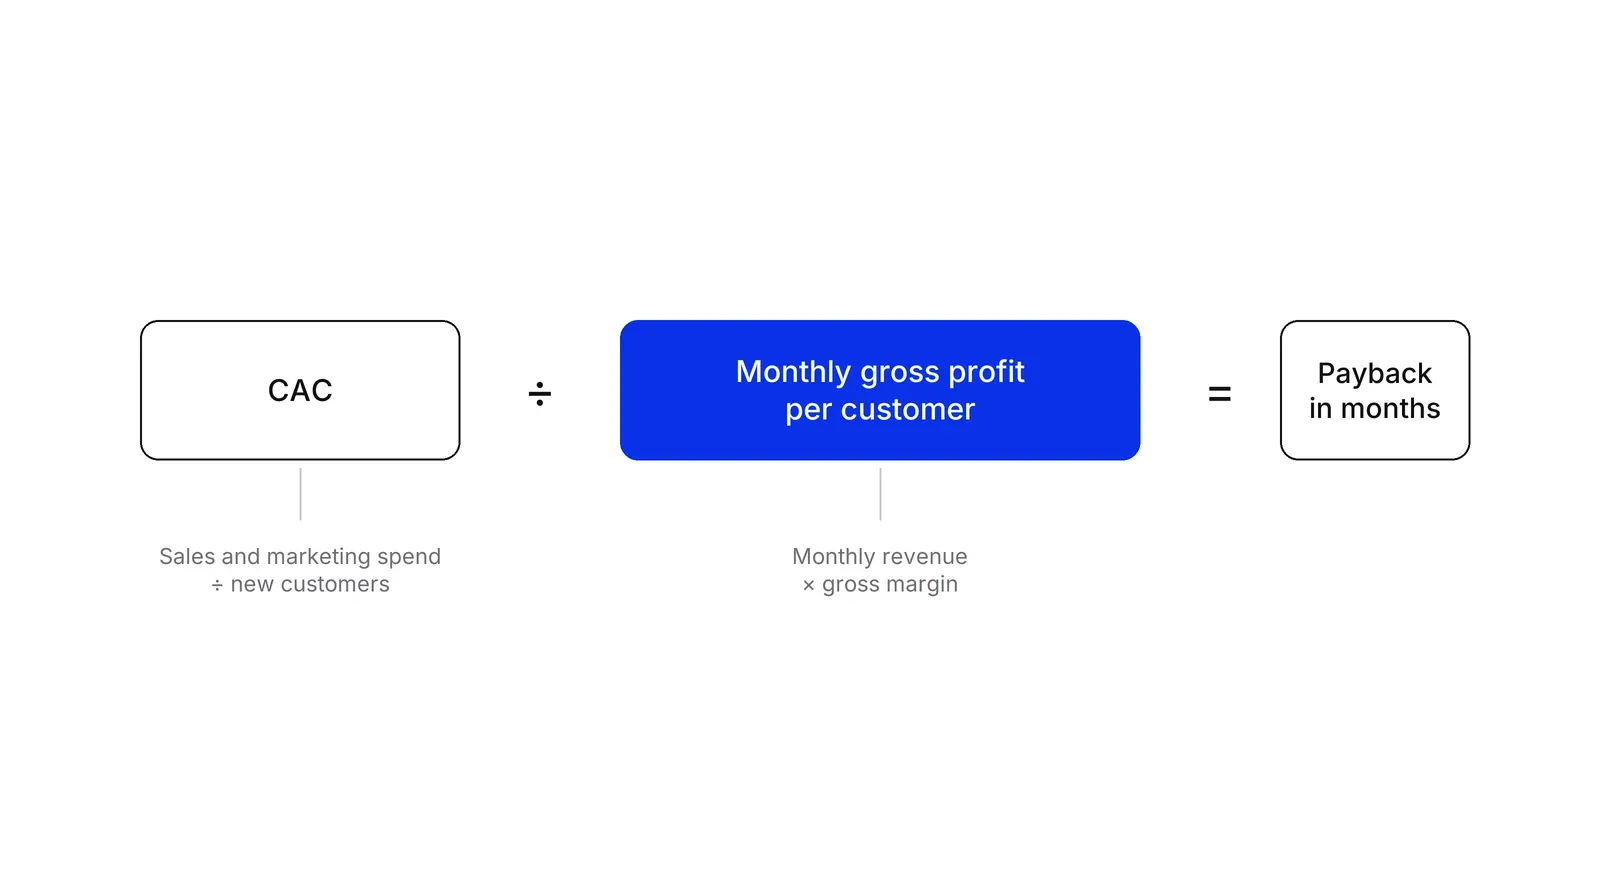
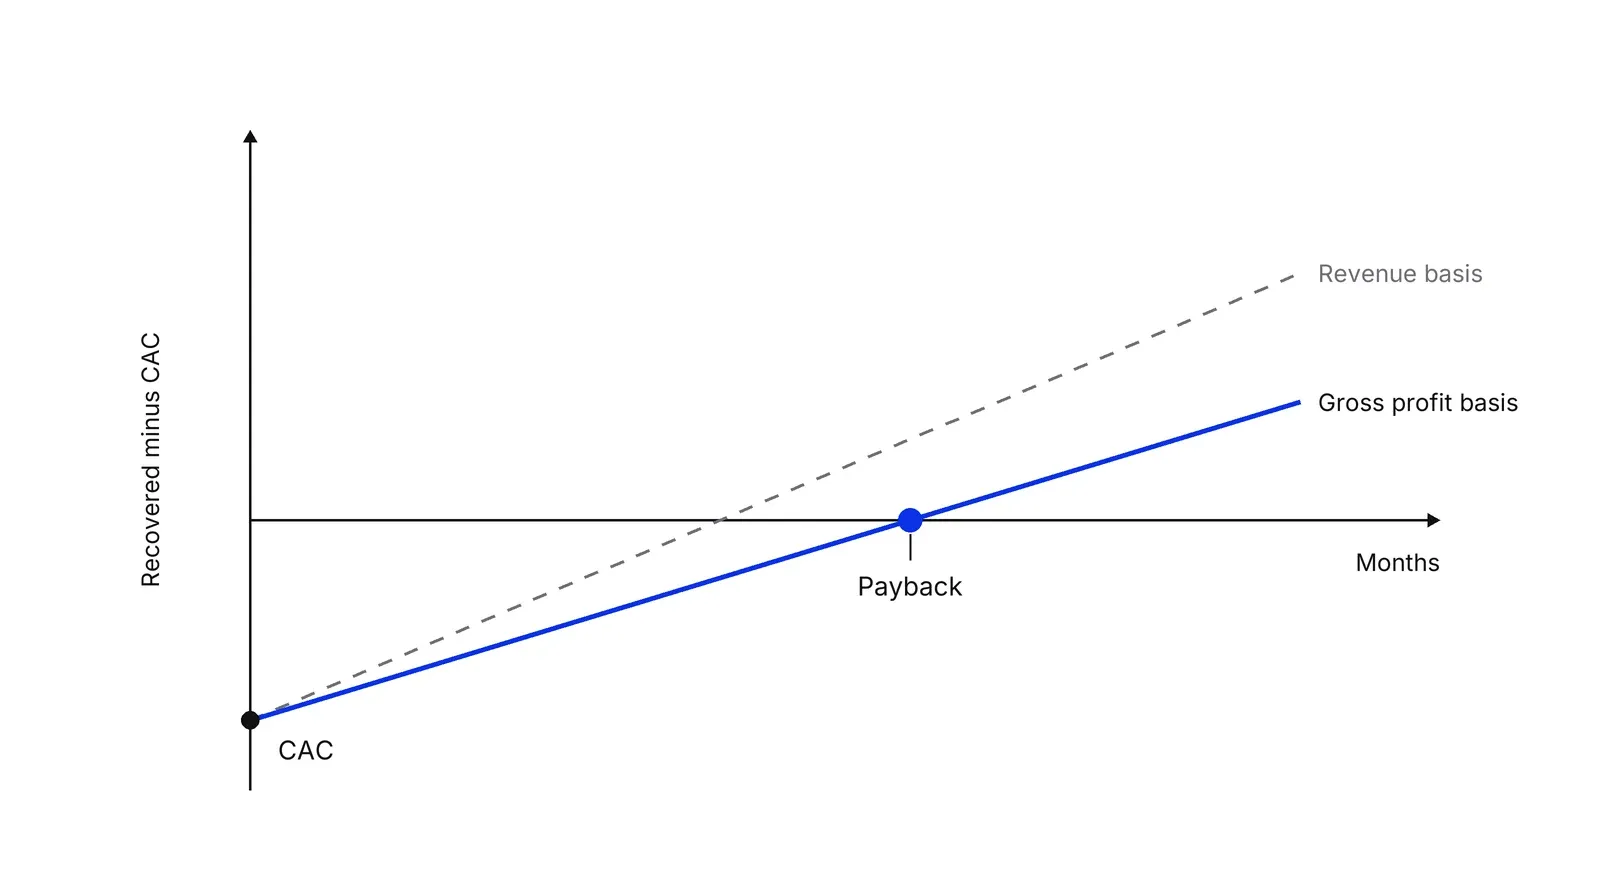
Take an illustrative company whose CAC is $630 (ChartMogul’s formula applied). Each customer pays $60 a month, and gross margin is 70%, so each leaves $42. Payback is 15 months. Divide by revenue and the answer is 10.5 months. The gap is the cost of serving the customer, which the acquisition money cannot be repaid from.
Gross margin belongs in the denominator because a customer repays CAC only from what is left after delivery costs. Ray Rike of Benchmarkit, writing for SaaS Barometer, shows one company’s payback dropping from 22.5 to 18 months when the margin adjustment is removed. Skok’s own essay does not apply the adjustment, but he says lower-margin businesses should adjust.
Gross margin is not the same as contribution margin. Contribution margin also removes variable selling costs such as commissions. Andreessen Horowitz’s 16 startup metrics points to the contribution-margin version of LTV to CAC as a good measure for CAC payback, so a business with heavy commissions may want the stricter number.
Which version of the number are you reading?
There is no single standard, and comparing a figure from one source with another is the most common error. Rike lists two common definitions in a 2024 SaaS Barometer post. The SaaS Metrics Standards Board version divides fully loaded sales and marketing by new-customer contracted ARR times subscription gross margin, then multiplies by 12. The public-company version used by analyst Jamin Ball divides the previous quarter’s sales and marketing by net new ARR times gross margin. Net new ARR already nets out churn and downgrades, so the two can differ widely for the same company.
Whether expansion revenue from existing customers is counted matters too. In the same post, Benchmarkit’s 2024 median blended CAC ratio is $1.59 of spend per $1 of new ARR, against $1.85 for new customers alone, so including expansion flatters efficiency. Report new-customer payback, label it, and keep the same definition every quarter.
Benchmarks, with their sources
Treat every benchmark as a statement about one dataset, one year and one formula. The table lists what the publishers say.
| Source | Year and sample | Reported figure |
|---|---|---|
| Bessemer scaling guide | Published 2021; Bessemer portfolio, 2010 to 1H21, not a random sample; gross-margin adjusted | Targets under 12 months SMB, under 18 mid-market, under 24 enterprise; average 15 months for the smallest ARR band |
| Bessemer, health tech benchmarks | Published 2022; 52 companies | Healthcare SaaS: below 20 months, gross-margin adjusted |
| KeyBanc and Sapphire, 14th survey | 2022 data; 100+ private SaaS companies, median ARR $25.5M | Median about 23 months |
| Benchmarkit 2025 with Maxio | 2024 data; 500+ B2B SaaS companies | Median payback up 12.5% since 2022; about 12 months called good, and strongly linked to contract size |
| Aleph and Benchmarkit 2026 | 2025 data; 342 companies, 198 reporting payback | Median 16 months (18 in 2024); 11 months in the lowest contract-size band and 22 in a mid-size band, per the Aleph write-up |
The numbers disagree because the samples differ: private against portfolio companies, different years, different formulas. The Aleph and Benchmarkit and Bessemer figures are gross-margin adjusted. The KeyBanc and Sapphire press release does not state its formula, so check the full report before comparing. Skok’s guideline is the oldest rule of thumb: the best businesses recover CAC in 5 to 7 months, and profitability turns anemic beyond 12, though his later notes say 20 months is common in healthy companies.
Contract size explains most of the spread. A low-priced product that sells through self-serve can repay in under a year, while a large enterprise contract with a long sales cycle often takes two years, and investors accept that because enterprise customers tend to stay longer.
What payback leaves out
Payback measures speed, not value. It stops counting at the payback month, and it assumes the customer is still paying then. OpenStax lists the same limits for capital projects: no time value of money, and no view of what happens after repayment. Graham and Harvey’s survey of 392 CFOs found 74.9% always or almost always use NPV and 75.7% IRR, with small firms leaning more on payback. That fits how founders use it: quick, simple and incomplete.
Retention is the missing half. Gupta, Lehmann and Stuart’s Journal of Marketing Research paper estimates that a 1% gain in retention lifts customer value by 3 to 7%, while a 1% cut in acquisition cost moves it by only 0.02 to 0.3%. Our worked example makes the point: with 3% monthly churn, the $42 customer takes about 20 months to repay $630, not 15. Pair payback with net revenue retention, cohort curves and the LTV to CAC ratio. For a subscription model, SaaS Capital’s 15th annual survey of private B2B SaaS companies found that moving NRR from the 90-100% band to 100-110% lifts median growth by 5 percentage points.
Blattberg and Deighton made the older version of this argument in Harvard Business Review in 1996, quoting a Lands’ End chief executive who said the company does not make money unless it keeps a customer for several years. A Growth Lab plan starts from the payback of each channel, so budgets follow the channels that return cash fastest.
How to apply CAC payback period, step by step
- Fix the cost side. Add up all sales and marketing spend for one period: ad budgets, salaries, commissions, tools and agency fees. Lag the spend by one sales cycle if deals take months to close. Result: one cost figure that matches the customers it won.
- Compute CAC. Divide that spend by the number of new customers from the same window. Count new customers only, not renewals. Result: the average cost of winning one customer.
- Compute monthly gross profit per customer. Multiply average monthly revenue per new customer by gross margin, where gross margin is revenue minus the direct cost of delivering the service (hosting, support, payment processing, clinical staff). Result: the cash each customer leaves each month to repay CAC.
- Divide and label the method. CAC divided by monthly gross profit gives payback in months. Write down whether you used new customers only or blended revenue, and whether margin was applied. Result: a number you can compare with the same method next quarter.
- Cut by segment and channel. Repeat the calculation for each plan tier, customer size and acquisition channel. Result: a table that shows which segments repay quickly and which tie up cash.
- Test it against retention. Check that the average customer actually stays past the payback month, using a cohort retention table. Result: a payback figure that survives churn, or a clear signal that it does not.
Examples
A B2B software company (illustrative)
Winning one customer costs $630 in spend. Each customer pays $60 a month at a 70% gross margin, leaving $42 of gross profit. Payback is $630 divided by $42, which is 15 months. On revenue alone the same company would report 10.5 months, which flatters it by four and a half months.
A payments company onboarding merchants (illustrative)
Winning a merchant costs $540. After network and interchange costs the company keeps $120 a month from that merchant. Payback is 4.5 months. A merchant who leaves after three months, though, never repays the cost, so churn in the first quarter matters more than the formula.
A membership clinic (illustrative)
A clinic spends $450 on ads and front-desk time to sign one member at $99 a month. After clinician time and supplies the margin is 60%, so $59.40 a month. Payback is about 7.6 months. If half of new members leave before month eight, the clinic loses money on the average member despite a payback that looks short.
When to use it
Use it when you buy customers with spend that returns as monthly or recurring gross profit: subscriptions, memberships, merchants who transact every month. It is most useful when cash is limited, because it shows how long each growth dollar is tied up.
When not to use it
Skip it as the only test for one-off sales with no repeat purchase, where margin on the first order is the whole story. Do not rely on it alone when retention is poor or unknown, since it assumes the customer stays until payback. In early weeks of a new channel the sample is too small for a stable figure.
Common mistakes
- Dividing by revenue instead of gross profit. In the worked example, a 70% margin turns a 10.5-month payback into 15 months, and the revenue version is the one that gets people into trouble.
- Leaving costs out of CAC: founder time, sales salaries, tools and agency fees. A figure built from ad spend alone understates payback.
- Blending expansion revenue from existing customers into a new-customer payback. It makes acquisition look cheaper than it is, so label which version you report.
- Comparing your number with a benchmark built on a different formula, customer size or year. Public-company, private-survey and investor-guide figures use different definitions.
- Ignoring churn. Payback assumes the customer is still there in the payback month, and a high early churn rate can push the real recovery out by a year or more.
FAQ
What is a good CAC payback period?
It depends on customer size. Bessemer's 2021 guide targets under 12 months for SMB, 18 for mid-market and 24 for enterprise. The 2026 Aleph and Benchmarkit report puts the median at 16 months across 342 companies. Shorter is better, but only if customers stay.
How do you calculate CAC payback period?
Divide sales and marketing spend by the number of new customers to get CAC, then divide CAC by monthly revenue per customer multiplied by gross margin. The result is months. Annual versions divide spend by new-customer annual revenue times gross margin, then multiply by 12.
Should CAC payback use revenue or gross margin?
Gross margin. A customer repays acquisition cost from what is left after the cost of serving them, not from revenue. Benchmarkit and Bessemer both report payback on a gross-margin-adjusted basis, and dropping the adjustment can shorten the figure noticeably.
What is the difference between CAC payback and LTV to CAC?
CAC payback measures how fast a customer repays the acquisition cost. The LTV to CAC ratio measures how many times lifetime value covers it. Payback speaks to cash and risk in the first months. The ratio speaks to the total return over the whole customer life.
How is CAC payback different from the payback period in finance?
Finance uses payback for an investment's cash flows, and CAC payback applies the same idea to a customer. Both ignore the time value of money and cash after the payback date, which is why OpenStax calls payback a screening tool.
Sources
- Bessemer Venture Partners, scaling guide for cloud companies (2021)
- Bessemer Venture Partners, Benchmarks for growing health tech businesses (2022)
- Bessemer Venture Partners, State of the Cloud 2023
- Aleph, CAC payback period for SaaS (data from the Aleph and Benchmarkit report)
- Benchmarkit, 2025 SaaS Performance Metrics
- Maxio and Benchmarkit, 2025 B2B SaaS Benchmarks Report
- Baker Tilly and Benchmarkit, B2B SaaS benchmark report (July 2025)
- Sapphire Ventures and KeyBanc Capital Markets, 14th annual Private SaaS Company Survey
- SaaS Capital, 2026 Private B2B SaaS Company Growth Rate Benchmarks
- Ray Rike, SaaS Barometer, Customer Acquisition Cost Payback Period (November 2024)
- Ray Rike, SaaS Barometer, Customer Acquisition Cost Efficiency (May 2024)
- David Skok, For Entrepreneurs, SaaS Metrics 2.0
- David Skok, For Entrepreneurs, SaaS Metrics 2.0 definitions
- ChartMogul, CAC payback
- Corporate Finance Institute, CAC payback period (Anna Talerico, 2024)
- Andreessen Horowitz, 16 startup metrics (2015)
- OpenStax, Principles of Accounting Vol. 2, 11.2 Payback and accounting rate of return
- Graham and Harvey, How do CFOs make capital budgeting and capital structure decisions?, Journal of Applied Corporate Finance, 2002
- Gupta, Lehmann and Stuart, Valuing Customers, Journal of Marketing Research, 2004
- Blattberg and Deighton, Manage Marketing by the Customer Equity Test, Harvard Business Review, 1996
Last updated Oct 9, 2026


Marketing agency or growth system: when a company outgrows its agency
An agency is the right call while the founder still runs most of the company. Once the business starts copying itself into new locations or markets, it needs a system that sets goals, tests hypotheses and owns the result.

Why healthcare marketing agencies stall: the short, mid and long wins model we use with clinics
Most agencies own the click and nobody owns the front desk. How we structure clinic work in three horizons, the research behind each one, and one year of results.

How to calculate channel payback and unit economics
A CAC number that only marketing believes will not survive a finance review. This guide calculates channel payback so both teams work from the same model.