RFM analysis
RFM analysis scores every customer on how recently they bought, how often and how much, so a team can sort a customer base into segments and decide who gets which message.
RFM analysis is a customer segmentation method that scores each customer on recency (how recently they bought), frequency (how often) and monetary value (how much they spent), usually from 1 to 5 each. The three scores combine into segments such as champions or at-risk buyers, so a team can decide who gets which message. It needs only order history.
- Origin
- Direct-mail and catalogue marketers (the practice); Arthur Hughes (book treatment, Strategic Database Marketing), In print by 1988; Hughes 1994
- Level
- 201 · Tool
- Fits
- Small and mid-size, Scale-up
- Time to apply
- Half a day for a first scoring run
- What you need
- an order or payment table with a customer ID, a date and an amount · one agreed window, such as the last 12 months · a spreadsheet, SQL or the RFM report of your CRM or email tool
RFM analysis is a way to rank customers by three numbers taken from their purchase history: how recently they bought (recency), how often (frequency) and how much they spent (monetary value). Each customer gets a score on each measure, and the three scores together place the customer in a segment such as top buyers, lapsing buyers or lost ones. All it needs is a table of orders with a customer ID, a date and an amount.
The appeal is speed. A team can run it in a spreadsheet or SQL in an afternoon, and every segment can be explained in one sentence to a manager who has never seen a statistical model.
Where RFM came from, and where sources disagree
RFM grew out of catalogue and direct-mail selling, and no single inventor is documented. The best-known story is a recollection: Ron Kahan wrote in Journal of Consumer Marketing in 1998 that catalogers found by accident that recent buyers were the most likely to order again, and that he believed Sears was first. He put it as a belief.
The printed record is older than most explainers suggest. Connie Bauer published a direct mail customer purchase model in 1988, and later papers cite her work as an example of RFM-based rules for choosing whom to mail. Arthur Hughes’s book Strategic Database Marketing appeared in 1994. Hughes, who died in 2014, founded the Database Marketing Institute and worked on database and email marketing for over three decades, Chief Marketer reported. Fader, Hardie and Lee cite Hughes’s second edition of 2000 for the order of the letters.
Some web explainers name Bult and Wansbeek’s 1995 paper as the origin. That paper, Optimal Selection for Direct Mail, is about picking recipients by expected profit, and Naik and Piersma describe it as an extension of existing RFM-type models. Operations researchers kept using it: a 2002 Erasmus report on mailing decisions for a Dutch fundraiser defines each donor’s state in terms of recency, frequency and monetary value. A 2017 conference poster by Jim Porzak says early 1990s. Our reading: the practice predates 1988, Hughes gave it its best-known textbook form, and nobody has shown a first use.
The three measures, and why definitions differ
Recency, frequency and monetary value are simple on paper and slippery in a table. Tools disagree on the details, so write yours down.
| Measure | Common definition | Variant to watch |
|---|---|---|
| Recency | Days since the last purchase (Shopify) | The lifetimes library measures it from the first purchase to the last |
| Frequency | Orders in the window | lifetimes counts periods with a purchase, not orders |
| Monetary value | Total spend in the window (Shopify) | lifetimes and Fader, Hardie and Lee use the average per purchase |
Total and average spend answer different questions. Total spend rewards customers who buy often, so it overlaps with frequency. Average spend isolates how big each purchase is.
How the scoring works
Rank customers on one measure, cut the ranked list into five equal groups and give the top group a 5. Do it for all three measures. The three digits are written together, so 555 is the best customer and 111 the worst, and five levels on three measures give 125 cells. Kahan’s 1998 description is the same recipe, and he notes that it often shows the 80/20 pattern in which a small share of customers brings most of the revenue.
Tools vary the scale. Klaviyo scores 1 to 3 and by default gives a 3 on recency to a purchase in the last 180 days. Braze scores 0 to 3 over a window of up to 60 days. Amperity scores 1 to 10 by percentile over the previous 12 months. The scale matters less than keeping it fixed.
B2B teams without clean order values sometimes swap monetary value for the value of goal actions such as white paper downloads or event sign-ups, a variant called RFV.
From scores to segments
Teams merge the 125 cells into a few named groups, and the names are a convention, not a standard. Shopify’s report assigns customers to 11 groups using recency plus the rounded-down average of the frequency and monetary scores. Klaviyo lists six groups, from Champions to Inactive, and maps specific score combinations to each. Braze checks ten groups in priority order and puts each user in the first one they match.
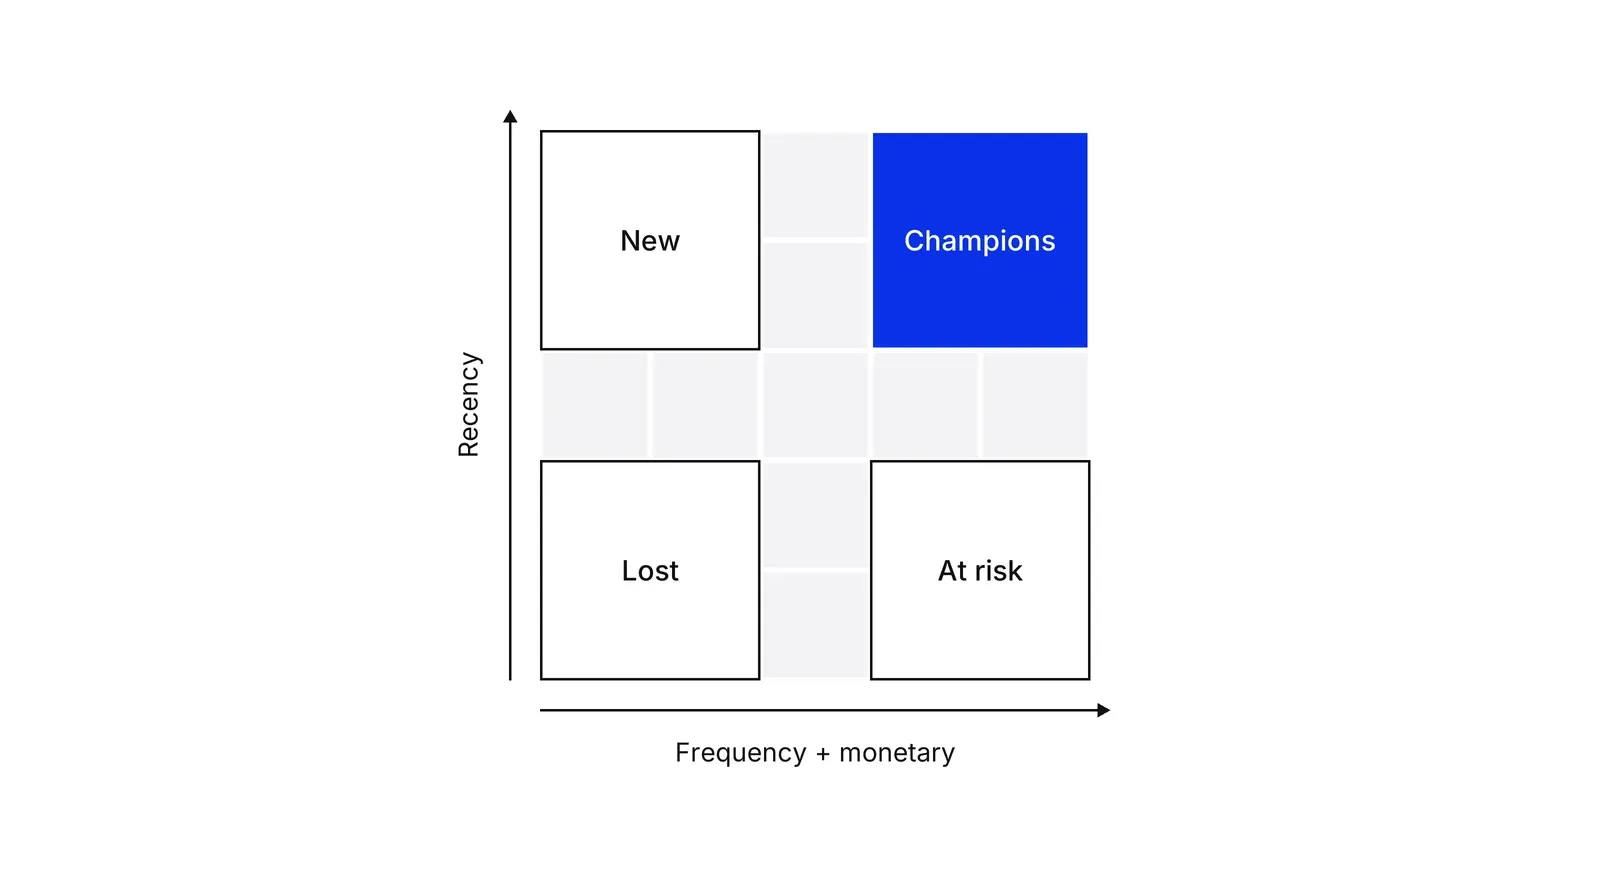
The corners are the easy part. Recent, frequent, high-spending customers are your champions, and long-lapsed, low-activity ones are probably gone. The money is in the lapsed group with high frequency and spend, which Braze calls “cannot lose them”. Klaviyo’s advice for slipping customers is a win-back campaign with an incentive or a request for feedback.
Does recency really matter most?
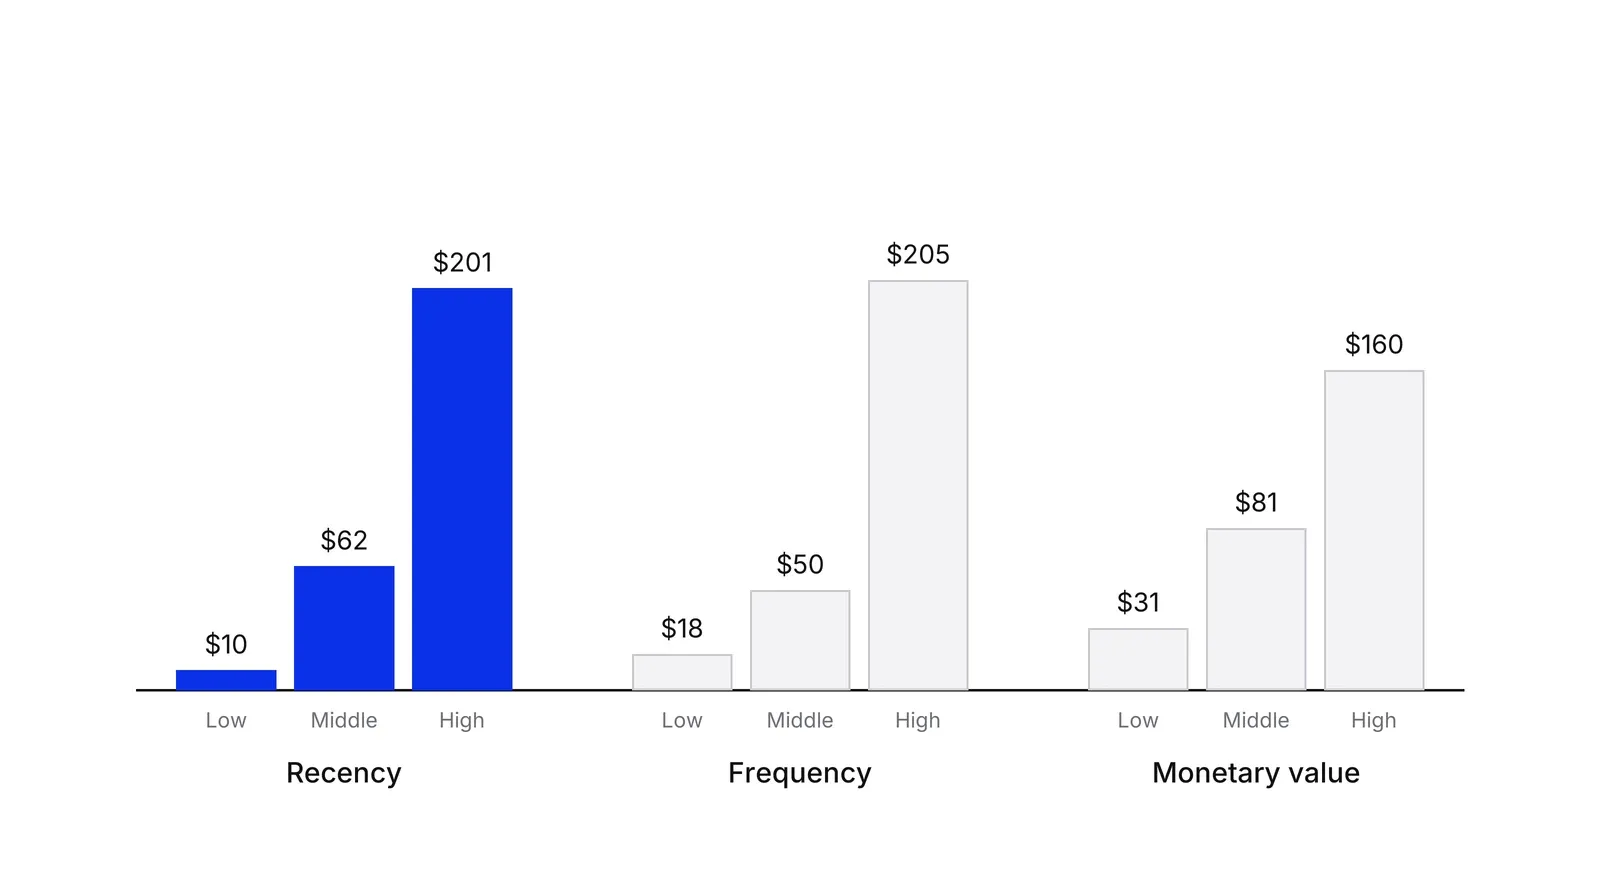
Usually, yes. Fader, Hardie and Lee studied the 23,560 customers of CDNOW’s first-quarter 1997 cohort and split them into terciles on each measure. The average future value of the least recent third was $10 and that of the most recent third was $201. Frequency ran from $18 to $205 and monetary value from $31 to $160. The authors read this as consistent with the widely held view that recency is the strongest discriminator, which they say is why the method is called RFM and not FRM.
The same paper finds monetary value close to independent of frequency among repeat buyers: a correlation of 0.11, falling to 0.06 once one outlier is removed. That is one dataset of an online music store, and the authors say it needs testing on others before it counts as a general rule.
What RFM cannot tell you
RFM describes the past. Amperity’s own documentation says its RFM scores cover a rolling year and are less accurate than predictive lifetime value for forward-looking questions. Fader, Hardie and Lee add three problems with scoring-model versions of RFM: they predict only the next period, they need two periods of data, and they treat observed RFM values as if they were fixed traits when they are noisy readings of behaviour.
The CDNOW data also shows a trap. For customers with low recency, higher past frequency went with lower future value, which the authors call the increasing frequency paradox. A customer who bought often and then went quiet may have left.
The fix keeps the inputs and changes the maths. The Pareto/NBD model of Schmittlein, Morrison and Colombo estimates the probability that a customer is still active from the number and timing of purchases, and Fader, Hardie and Lee pair it with a spend model to project lifetime value from recency, frequency and monetary value alone.
RFM is also silent on why people buy. It is a behavioural basis for market segmentation, and groups built on needs answer a different question. For the movement of the whole base from one period to the next, see growth accounting. A Growth Lab plan can start from the champions to protect and the at-risk buyers worth a win-back.
How to apply RFM analysis, step by step
- Fix the unit and the window. Decide what counts as a customer (a person, an account, a merchant) and what window you score, for example the trailing 12 months, which is what Amperity's built-in attributes use. Result: one customer definition and one date range written down.
- Build one row per customer. From the order table, compute the date of the last order, the number of orders and the total or average spend for each customer ID. Result: a table with R, F and M raw values.
- Score each measure from 1 to 5. Rank customers on each measure and cut the ranked list into five equal groups. Give the most recent buyers a 5 on recency, the most frequent a 5 on frequency and the biggest spenders a 5 on monetary value. Result: three scores per customer, with 555 the best and 111 the worst.
- Merge the 125 cells into named segments. Nobody can run 125 campaigns, so group the combinations into 5 to 11 named segments such as champions, loyal, at risk and lost. Result: a segment label on every customer and a count per segment.
- Give each segment one action and test it. Write one offer or message per segment, for example early access for champions and a win-back email for at-risk buyers. Send each to a sample first and compare response with your break-even rate before the full send. Result: a list of segments with a tested action and a go or no-go.
- Re-score on a schedule and watch the moves. Recalculate monthly, or daily if your tool does it, and track customers who move between segments, such as the ones who just became champions or just slipped to at risk. Result: a recurring report of segment sizes and movements.
Examples
Shopify's RFM report
Shopify scores each customer 1 to 5 on recency, frequency and monetary value, which gives 125 combinations, and sorts them into 11 groups from Champions to Dormant. Its guide suggests a product preview invitation for a champion scoring 555, and an offer based on a past purchase category for an at-risk customer scoring 244.
CDNOW, a documented dataset
Fader, Hardie and Lee studied 23,560 customers who made their first CDNOW purchase in the first quarter of 1997. Customers in the top tercile on recency, frequency and monetary value together made up about 38 percent of the cohort's future value, and the cohort's average value was about $47 per customer.
A payment provider scoring merchants
Illustrative. A provider with 1,000 merchants scores recency as days since the last processed payment, frequency as active days in the last 90 and monetary value as processed volume in the same 90 days, so each score level holds 200 merchants. A merchant who scores 2 on recency but 5 on frequency and 5 on monetary value used to be among the biggest and has gone quiet, so an account manager calls first.
When to use it
Use it when you have repeat purchases or repeat transactions, a customer ID and a few hundred customers or more, and you need a fast, explainable way to choose who to email, call or win back. It suits e-commerce, clinics, subscriptions that bill by usage and payment businesses.
When not to use it
Skip it for one-off purchases such as a home or a single surgery, where there is no repeat behaviour to score. Do not use it alone to forecast lifetime value or to value a customer base, because it only describes the past and gives no probability that a customer is still active.
Common mistakes
- Mixing definitions. Shopify counts monetary value as total spend in the window, while Fader, Hardie and Lee and the lifetimes library use average spend per purchase. Pick one and say which.
- Scoring recency the wrong way round, so that long-lapsed customers get a 5. Check that 555 is your best segment before anything is sent.
- Running 125 cells as 125 segments. Merge them into a handful that each have an action and an owner.
- Treating a high-frequency customer who has stopped buying as safe. In the CDNOW data, at low recency higher past frequency pointed to lower future value.
- Using a different window or thresholds every month, so segment sizes change for reasons that have nothing to do with customers.
FAQ
What is RFM analysis in marketing?
RFM analysis ranks customers on recency (days since the last purchase), frequency (number of purchases) and monetary value (amount spent). Each measure is scored, commonly from 1 to 5, and the scores place a customer in a segment. Marketers use the segments to choose offers, protect top buyers and win back lapsing ones.
What is the difference between ABC analysis and RFM analysis?
ABC analysis ranks customers or items on one measure, usually revenue, and cuts the ranking into A, B and C classes. RFM ranks customers on three measures at once, and one of them, recency, tells you whether a big customer is still buying. A large customer can be an A in ABC and at risk in RFM.
How many RFM segments should I use?
Use as many as you can act on. Tools differ: Klaviyo's built-in report has 6 groups, Braze lists 10 and Shopify's report has 11. Start with four to six, give each one action, and split a segment only when its members need a different message.
How often should RFM scores be recalculated?
Monthly is a workable default. Klaviyo updates its RFM properties daily, and Amperity's built-in attributes use a rolling 12 months. Whatever you choose, keep the window and thresholds fixed so that a change in segment size reflects customer behaviour, not a change in the rules.
Is RFM a good predictor of customer lifetime value?
It is a good starting point and a weak forecast. Fader, Hardie and Lee found recency and frequency strongly linked to future value in CDNOW data, yet RFM scores alone give no probability that a customer is still active. Probability models such as Pareto/NBD use the same inputs to project value.
Sources
- Peter Fader, Bruce Hardie and Ka Lok Lee, RFM and CLV: Using Iso-value Curves for Customer Base Analysis, Journal of Marketing Research 42(4), 2005 (working paper)
- Bruce Hardie, abstract of RFM and CLV: Using Iso-value Curves for Customer Base Analysis
- David Schmittlein, Donald Morrison and Richard Colombo, Counting Your Customers: Who Are They and What Will They Do Next?, Management Science 33(1), 1987
- Jan Roelf Bult and Tom Wansbeek, Optimal Selection for Direct Mail, Marketing Science 14(4), 1995
- Connie Bauer, A Direct Mail Customer Purchase Model, Journal of Direct Marketing 2(3), 1988
- Ron Kahan, Using database marketing techniques to enhance your one-to-one marketing initiatives, Journal of Consumer Marketing 15(5), 1998
- Prasad Naik and Nanda Piersma, Understanding the Role of Marketing Communications in Direct Marketing, working paper, 2002
- Jedid-Jah Jonker, Richard Paap and Philip Hans Franses, Modeling charity donations: target selection, response time and gift size, Econometric Institute report EI 2000-07/A, 2000
- Jim Porzak, RFM in the 21st Century, useR! 2017 poster
- Chief Marketer, Database guru Arthur Hughes dies
- Jedid-Jah Jonker, Nanda Piersma and Rob Potharst, Direct Mailing Decisions for a Dutch Fundraiser, ERIM report ERS-2002-111-LIS, 2002
- Steve Smith, Pumping up email IQ with catalog RFM, MediaPost, 2008
- IBM, SPSS Statistics: RFM analysis
- Shopify, RFM analysis: definition and segmentation guide
- Amperity Docs, Recency, frequency, monetary
- Klaviyo Academy, RFM analysis
- Klaviyo Academy, Identify key customer cohorts with the RFM analysis
- Braze Docs, RFM SQL segments
- Braze, RFM segmentation
- lifetimes documentation, Quickstart (BG/NBD and Gamma-Gamma models)
Last updated Oct 9, 2026


Marketing agency or growth system: when a company outgrows its agency
An agency is the right call while the founder still runs most of the company. Once the business starts copying itself into new locations or markets, it needs a system that sets goals, tests hypotheses and owns the result.

Why healthcare marketing agencies stall: the short, mid and long wins model we use with clinics
Most agencies own the click and nobody owns the front desk. How we structure clinic work in three horizons, the research behind each one, and one year of results.

Why channel tests stall after month three
Most paid channel tests do not end with a decision. They end when the budget runs out, the attribution model changes, or everyone quietly stops looking at the dashboard.