Experience management (XM)
Experience management (XM) is the practice of collecting how customers and employees feel, joining it to the operational data a company already holds, and using the combined view to decide what to fix.
Experience management (XM) is a way of running a company that joins experience data, what customers and employees say about their dealings with you, to operational data such as billing, usage and staffing. The goal is to see which experience problems cost money and fix those first. The label was popularized by Qualtrics, so treat its category claims as vendor positioning.
- Origin
- Qualtrics (the XM category label); academic roots in Pine and Gilmore, and Heskett and colleagues, XM platform launched 2017; roots in the 1990s
- Level
- 401 · Expert
- Fits
- Enterprise
- Time to apply
- two to three weeks to link one survey to one operational dataset and read a first result
- What you need
- one survey or feedback source that already runs, such as post-support or post-visit ratings · one operational dataset that shares an ID with it, such as billing, usage or CRM records · a person who owns the number the finding should move, such as churn or repeat purchase
Experience management (XM) is the practice of collecting how customers and employees feel about their dealings with a company, joining that to the operational data the company already holds, and using the combined view to decide what to fix. It extends voice of customer work from “what are people saying” to “what does it cost us.”
Where the term came from
XM is a category that Qualtrics says it pioneered. It called itself “the global pioneer of the experience management (XM) software category” when SAP agreed in November 2018 to buy it for $8 billion in cash. Techzine reported the deal completed in early 2019. SAP then moved to float Qualtrics again in January 2021, and in March 2023 Silver Lake and CPP Investments agreed to buy it for about $12.5 billion. An analyst at Constellation Research described the SAP deal as investment in a new category covering customer, product, brand and employee experience.
The ideas under the label are older and come from outside the vendor. Joseph Pine and James Gilmore argued in 1998 that companies would compete by staging experiences. The service-profit chain, published in 1994, tied employee investment to customer loyalty and profit. When you read XM claims, separate the label (Qualtrics) from the research (many authors).
X-data and O-data
Qualtrics defines X-data as information about how people think and feel about their interactions with an organization, and O-data as what systems such as CRM, HR, finance and supply chain record. Its point: O-data shows what happened and often not why. It lists six kinds of X-data, from expectations before an interaction to ad-hoc diagnostics.
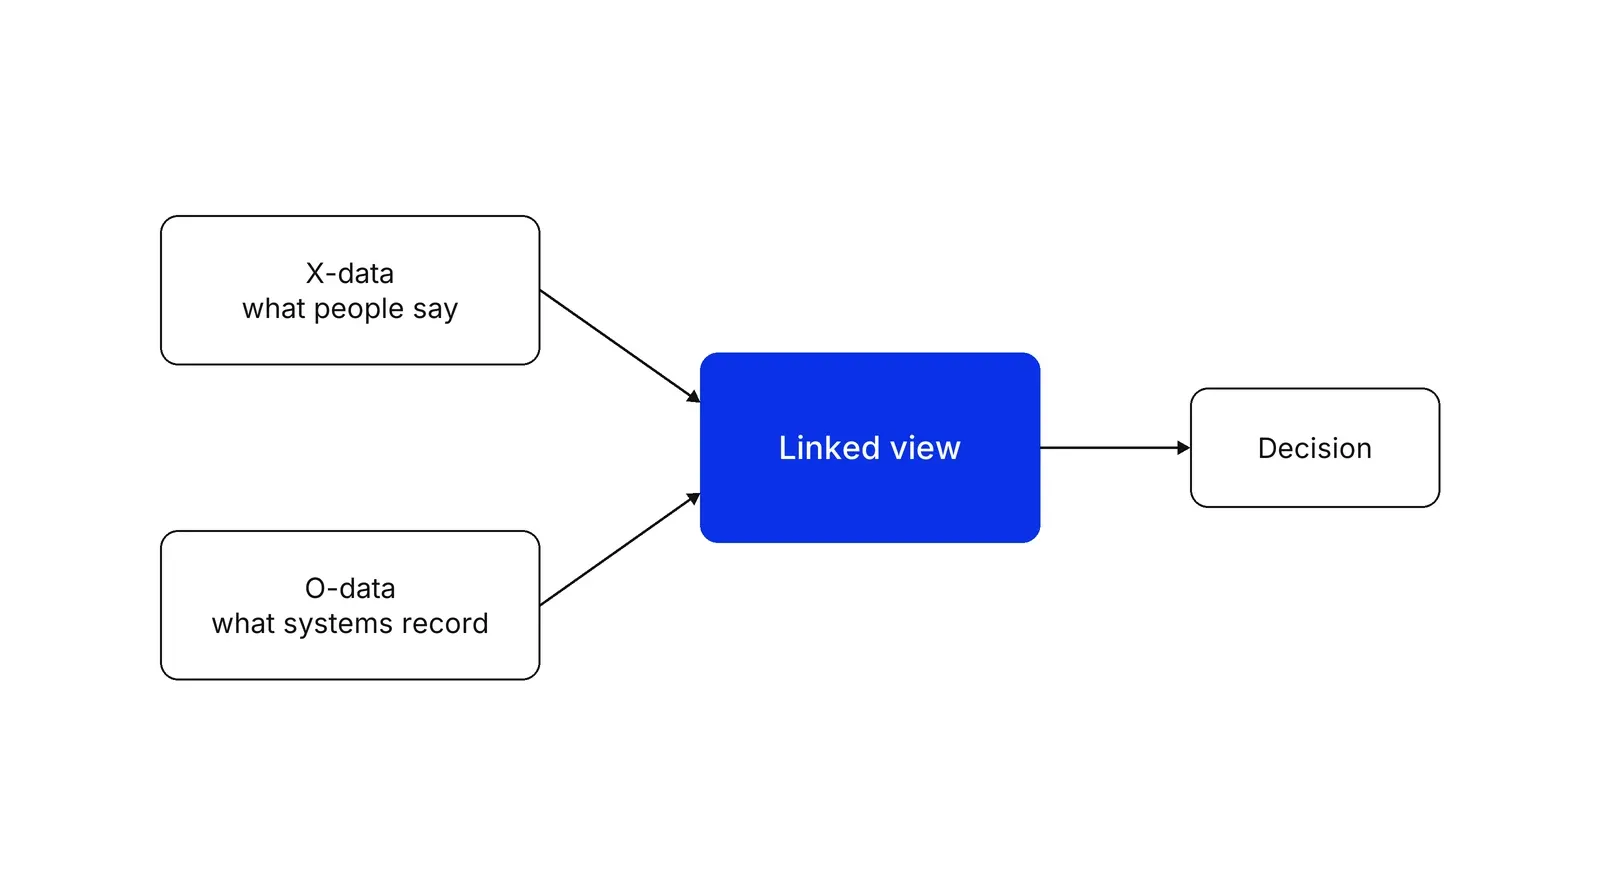
Take a hypothetical hospital group. A survey says outpatients are annoyed. Appointment records show the annoyed ones waited past their slot. The survey alone says “improve service”; the join says “fix the scheduling template.” Tools like CSAT and CES and NPS supply X-data, while a customer journey map shows where to attach it.
What XM covers
The XM Institute, launched by Qualtrics in July 2020 and led by Bruce Temkin, organizes the field into four experiences: customer, employee, product and brand. Brand tracking, for instance, is covered by brand health tracking. The grouping is the vendor’s own, and it is a useful checklist rather than a law.
Academic work treats the topic more narrowly. Lemon and Verhoef’s 2016 review in the Journal of Marketing consolidated what is known about customer experience and journeys. Homburg, Jozic and Kuehnl, drawing on interviews with 52 managers, described customer experience management as a resource made of cultural mindsets, strategic directions and capabilities. A later review warned that the field had become a fragmented “umbrella construct”.
Does the link to money hold?
The honest answer is: sometimes, and you have to check. The strongest argument is the chain from employees to customers to revenue.
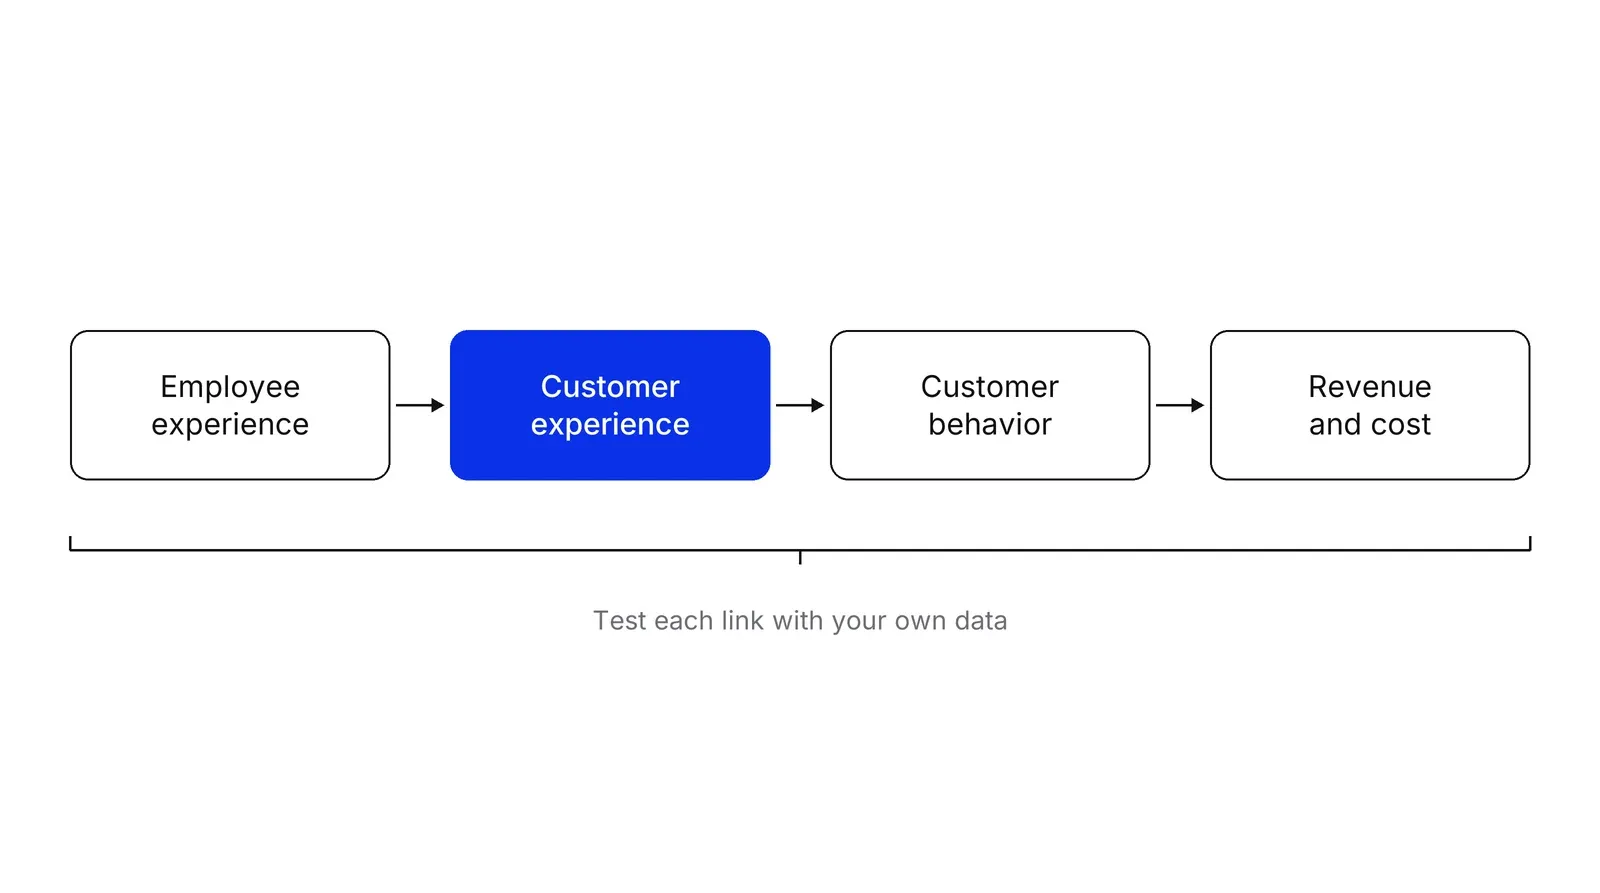
- Employees to customers. A meta-analysis by Brown and Lam found employee job satisfaction positively tied to customer satisfaction, with perceived service quality carrying the effect. Gallup’s business-unit study of 7,939 units reported similar positive links, and its authors noted that correlation is not causation.
- Satisfaction to behavior. Mittal and Kamakura studied 100,040 automotive customers, found that rating thresholds differ by customer group, and saw that in one group rated satisfaction had no correlation with repurchase at all.
- Behavior to profit. In a study of more than 500 bank branches in Brazil, Kamakura and colleagues concluded that superior satisfaction alone is not an unconditional guarantee of profitability.
- Experience to revenue. Forrester reported that AT&T U-Verse grew 35% a year against Comcast’s 6% between 2010 and 2014, but said the pattern holds only where customers can choose, and that health insurance was a counterexample.
- Experience to stock price. Fornell and colleagues reported market-beating returns from firms with high satisfaction scores. Later work by Ittner, Larcker and Taylor found no evidence that the scores predict long-run returns. Edmans found a 3.5% annual alpha for the “100 Best Companies to Work For” from 1984 to 2009.
XM does not need every link to hold. It needs you to find which ones hold in your business.
XM compared with neighbors
| XM | CX program | Voice of customer | |
|---|---|---|---|
| Who it covers | Customers, employees, product, brand | Customers | Customers |
| Core move | Join feedback to operational data | Improve journeys | Collect and analyze feedback |
| Typical owner | Executive team or a central insights group | CX or service lead | Research or support |
| Main risk | Platform before question | Scores without fixes | Feedback without action |
A service blueprint pairs well with XM because it shows which internal process sits behind each customer moment, so a finding has a place to land.
A Growth Lab plan starts from one outcome in money terms and works back to the feedback and records that explain it.
How to apply Experience management (XM), step by step
- Pick one outcome in money terms. Choose a single result the business already tracks: churn, repeat purchase, refund cost, staff turnover. Write the question as 'which experiences predict this?' Result: one outcome with an owner, so every later chart answers to a number someone cares about.
- List what you already collect. Sort existing data into two piles. Experience data is what people say: surveys, reviews, call transcripts. Operational data is what systems record: orders, tickets, logins, shifts. Result: a one-page inventory showing which pile is thin and which records share a customer or employee ID.
- Join one feedback source to one record set. Link survey responses to the same people's behavior using a shared ID, after checking consent and privacy rules. Start with a single touchpoint, for example a support chat and the customer's next 90 days of orders. Result: a table with a score and a behavior in the same row.
- Test whether the score predicts the outcome. Compare behavior across score bands, and across the people who did not answer. If satisfied customers leave at the same rate as unhappy ones, the question is wrong or the link is weak, and that is a finding. Result: a yes or no on whether this survey is worth acting on.
- Fix the costliest gap first. Rank the problems by the money tied to them, not by how loud the comments are. Assign each to the team that owns the process. Result: three or fewer fixes with owners and a date to re-read the score.
- Repeat for employees and one more domain. Once one customer loop works, run the same joins for employee feedback against turnover or error rates, then for a product or brand measure. Result: a short list of loops, each tied to one number.
Examples
A private clinic network
Illustrative: a network sends a two-question survey after every visit and keeps appointment records. Joining the two shows that patients who waited more than 25 minutes rebook at a lower rate regardless of how they rated the doctor. The fix goes to scheduling, not to bedside manner, because the operational data located the problem the survey only hinted at.
A payments company's support desk
Illustrative: a card-payments firm links post-chat ratings to the merchant's processing volume over the next quarter. Merchants who rated chats poorly and then filed a second ticket within a week cut volume the most. The company routes second tickets to a senior agent and watches volume, not the rating, as the measure of success.
When to use it
Use XM when feedback already exists in several places, such as surveys, support, reviews and staff pulse checks, and nobody can say which of it moves revenue or cost. It fits larger organizations with multiple teams that each own a piece of the experience, and the data to join them.
When not to use it
Skip a full XM program when the company is small enough that the founder reads every complaint, or when no operational data shares an ID with the feedback. A platform purchase will not fix either problem. Start with a single survey and a spreadsheet, and use a lighter method such as a customer journey map.
Common mistakes
- Buying a platform first and deciding the question later, so the dashboards multiply while no one owns a number.
- Treating a vendor's category claims and case studies as independent evidence that XM raises revenue.
- Joining survey scores to behavior but ignoring that the people who answer differ from the people who do not.
- Reporting an average score for the whole company when the problem sits in one process or one branch.
- Collecting employee feedback and never acting on it, which teaches staff that the survey is theater.
FAQ
What is experience management in simple terms?
Experience management is the discipline of measuring how customers and employees experience your company, joining that feedback to operational data, and acting on the result. Qualtrics popularized the term and describes it as built on experience data plus operational data. Academics usually study the same idea under customer experience management.
What is the difference between XM and CX?
Customer experience (CX) is what customers go through. XM, as Qualtrics frames it, is wider: it covers customer, employee, product and brand experience and the data systems that connect them to business results. In practice a CX program is often the first loop inside an XM effort.
Who invented experience management?
No single inventor. The ideas trace to academic work on the experience economy (1998) and the service-profit chain (1994). The XM label as a software category was popularized by Qualtrics, which called itself its pioneer when SAP announced the 2018 acquisition. Sources outside the vendor describe it as a category, not a settled field.
What are X-data and O-data?
Qualtrics defines X-data as information about how people think and feel about their interactions with an organization, and O-data as the operational data from systems such as CRM, HR, finance and supply chain. The idea is that O-data shows what happened and X-data helps explain why.
Does better customer experience raise revenue?
Evidence is mixed. Forrester reports that leaders outgrew laggards in several markets, but only where customers could switch and offers differed. Academic tests of satisfaction and stock returns disagree with each other. Test the link in your own data before betting a budget on it.
Sources
- Qualtrics, Driving insights with X- and O-data
- Qualtrics, Launches the XM Institute (2020)
- Goodwin, SAP SE to acquire Qualtrics International Inc. (2018)
- Constellation Research, Experience Management Drives SAP's Acquisition of Qualtrics
- Techzine, SAP completes takeover of Qualtrics (2019)
- TechCrunch, The long road to the Qualtrics IPO (2021)
- Qualtrics, Qualtrics to be acquired by Silver Lake and CPP Investments (2023)
- Katherine Lemon and Peter Verhoef, Understanding Customer Experience Throughout the Customer Journey, Journal of Marketing 80(6), 2016
- Christian Homburg, Danijel Jozic, Christina Kuehnl, Customer experience management: toward implementing an evolving marketing concept, JAMS 45(3), 2017
- Kranzbuhler, Kleijnen, Morgan, Teerling, The Multilevel Nature of Customer Experience Research, International Journal of Management Reviews (summary, SERVSIG)
- Joseph Pine and James Gilmore, Welcome to the Experience Economy, Harvard Business Review, July 1998
- Heskett, Jones, Loveman, Sasser, Schlesinger, Putting the Service-Profit Chain to Work, Harvard Business Review (1994, reprinted 2008)
- Harter, Schmidt, Hayes, business-unit meta-analysis of employee engagement and outcomes, Journal of Applied Psychology 87(2), 2002 (Boise State summary)
- Steven Brown and Son Lam, A Meta-Analysis of Relationships Linking Employee Satisfaction to Customer Responses, Journal of Retailing 84(3), 2008
- Kamakura, Mittal, de Rosa, Mazzon, Assessing the Service-Profit Chain, Marketing Science 21(3), 2002
- Vikas Mittal and Wagner Kamakura, Satisfaction, Repurchase Intent, and Repurchase Behavior, Journal of Marketing Research 38(1), 2001
- Fornell, Mithas, Morgeson, Krishnan, Customer Satisfaction and Stock Prices: High Returns, Low Risk, Journal of Marketing 70(1), 2006
- Ittner, Larcker, Taylor, The Stock Market's Pricing of Customer Satisfaction, Marketing Science, 2009 (Stanford GSB)
- Alex Edmans, Does the stock market fully value intangibles? Employee satisfaction and equity prices, Journal of Financial Economics 101(3), 2011
- Forrester, Customer Experience Leaders Crush Laggards On Revenue Growth
- George Colony, Forrester blog, Good customer experience drives revenue growth (2015)
Last updated Oct 9, 2026


The compliance layer under fintech marketing operations
A fintech marketing agency can build campaigns. It cannot own the compliance review, the KYC drop-off or the multi-market licensing rules that decide whether a lead ever becomes a customer.

Fractional CMO: what you get, and what has to exist underneath
A fractional CMO brings strategy and judgment. Without reporting, CRM hygiene and a named owner per number, the engagement produces a slide deck instead of a system.

The operations layer behind healthcare patient acquisition
Ads and search bring the request in. What happens between the click and the booked, attended visit decides whether the spend paid off.