Viral coefficient (K-factor)
The viral coefficient, or K-factor, measures how many new users each user brings in, so a team can predict how far word of mouth and invites will carry growth and which lever to pull next.
The viral coefficient, or K-factor, is the number of new users each existing user brings in during one cycle, usually calculated as invites sent per user multiplied by the share of invites that convert. A K above 1 means each group of users recruits a larger group. Below 1, invites still multiply every other channel by 1 / (1 - K).
- Origin
- David Skok and Andrew Chen popularised the formula; the idea comes from R0 in epidemiology, 2008 (Chen); c. 2009 (Skok)
- Level
- 301 · Advanced
- Fits
- Startup, Scale-up
- Time to apply
- One hour to calculate from existing data; one cohort cycle to measure cleanly
- What you need
- invite or share events tagged with the sender's user ID · sign-up data that records which invite or link brought each new user · the date of each user's sign-up, to group users into weekly or monthly cohorts
The viral coefficient, or K-factor, is the average number of new users that each existing user brings in during one cycle. The standard formula, set out by David Skok in his essay on viral marketing, is K = i x c: invites sent per user multiplied by the share of invites that convert. The letter K and the logic come from epidemiology, where the same quantity is called the reproduction number. Growth teams at consumer apps, collaboration tools, marketplaces and fintech products use K to forecast how much of their growth word of mouth will carry, and which part of the invite flow to fix first.
This page covers the arithmetic. How a viral loop fits next to content and paid loops is covered in growth loops.
How is the viral coefficient calculated?
Multiply two numbers measured on the same group of users, as in Skok’s model. Take 1,000 people who signed up in one week. In their first 7 days they send 5,000 invites to unique recipients, so i = 5. Of those 5,000 recipients, 800 sign up and activate, so c = 16%. K = 5 x 0.16 = 0.8.
Skok’s model makes one further assumption: only the users added in the last cycle send invites. So the 1,000 users bring 800, those 800 bring 640, and so on. Each generation is the previous one multiplied by K.
| Cycle | New users at K = 0.8 | New users at K = 1.2 |
|---|---|---|
| 0 (starting cohort) | 1,000 | 1,000 |
| 1 | 800 | 1,200 |
| 2 | 640 | 1,440 |
| 3 | 512 | 1,728 |
| 4 | 409.6 | 2,073.6 |
| Total after 4 cycles | 3,361.6 | 7,441.6 |
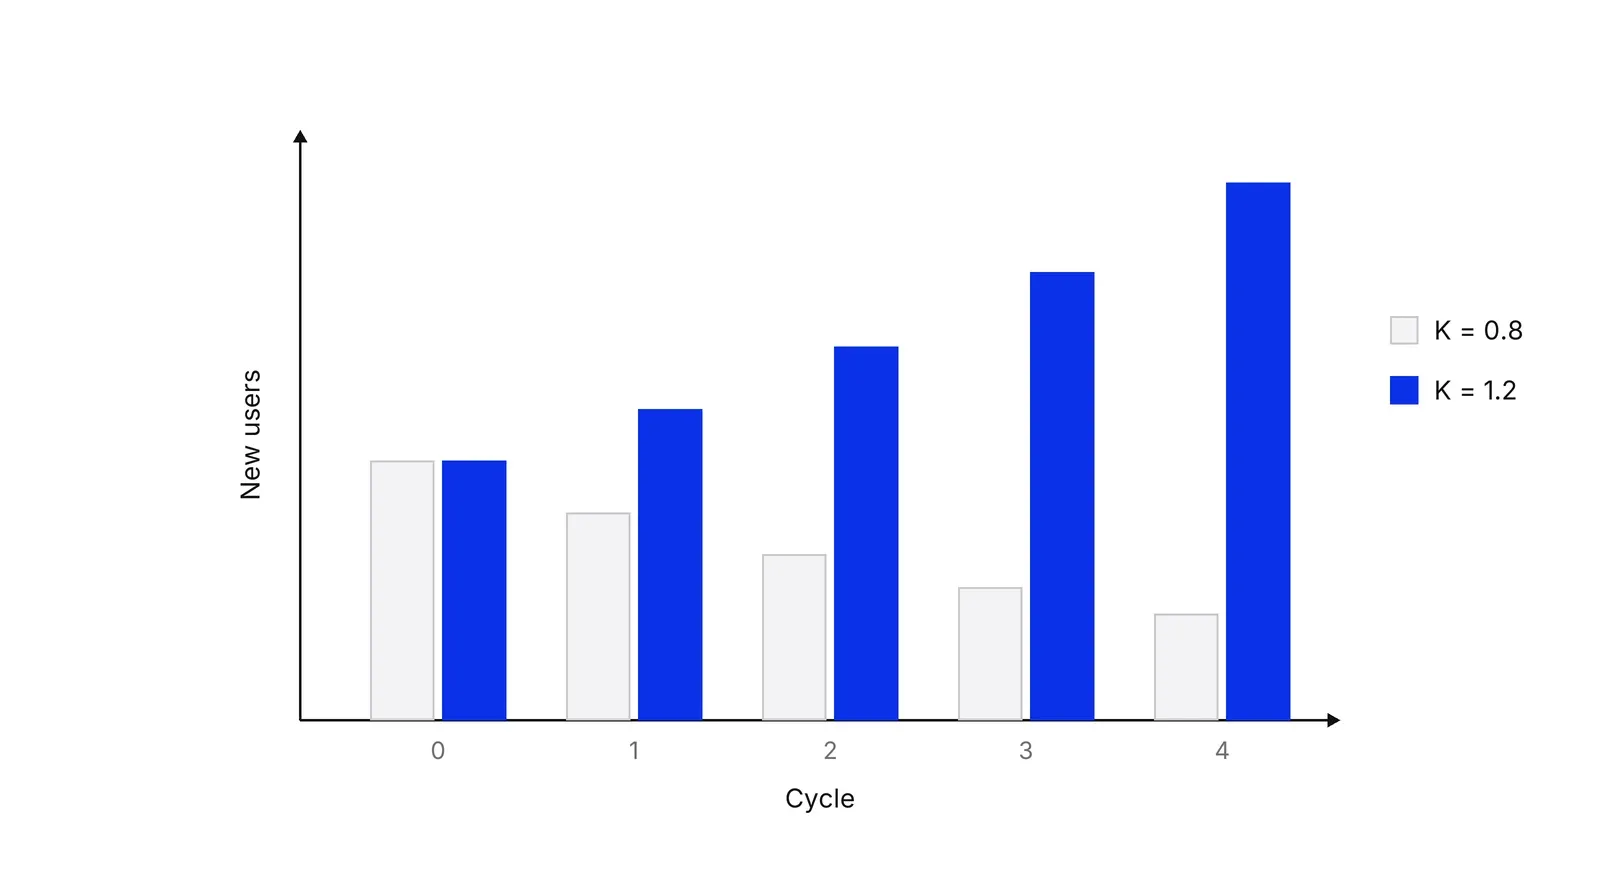
The totals follow a geometric series: users after n cycles = N0 x (1 - K^(n+1)) / (1 - K). For K below 1 the series has a ceiling, N0 / (1 - K). With K = 0.8 that is 1,000 / 0.2, or five times the starting cohort. Skok’s own version of this point is blunt: K “must be greater than 1 to have viral growth.” Eric Ries made the same cut in a 2008 post: above 1.0, “you generally have a viral hit on your hands.”
Why a K below 1 still matters
A K below 1 does not grow a product by itself, but it multiplies every other channel by 1 / (1 - K). If paid ads bring 1,000 users a week and K is 0.8, weekly sign-ups settle near 5,000. At $50 per paid user, the blended cost per user falls to $10.
Andrew Chen, who modelled the viral coefficient of Facebook apps in 2008, argued in a 2025 essay that a viral factor above 0.5 can amplify other channels. The multiplier shows why: moving K from 0.8 to 0.9 doubles the multiplier, from 5 to 10. Near 1, small gains in K have large effects.
Cycle time: how often K compounds
Viral cycle time is the time between a user signing up and their invitees signing up. K says how much each round multiplies users; cycle time says how many rounds you get in a month.
Skok’s spreadsheet model treats cycle time as a separate input, and the effect is large. Keep K at 1.2 and start from 1,000 users. On a 7-day cycle, 28 days give 4 cycles and 7,441.6 users. On a 3.5-day cycle, the same 28 days give 8 cycles and 1,000 x (1.2^9 - 1) / 0.2 = 20,798.9 users. Same product, same conversion, almost three times the users. That is why teams prompt invites during onboarding instead of waiting for a user to discover the share button in week three.
Epidemiologists call this the generation interval. Wallinga and Lipsitch showed in 2007 that the link between a reproduction number and a growth rate depends on that interval. If every cycle takes the same time T, the daily growth rate is ln(K) / T. For K = 1.2 and a 7-day cycle that is about 2.6% a day.
The link to R0 in epidemiology
The basic reproduction number R0 is the expected number of new cases one case causes in a population where everyone is susceptible. That definition is formalised by Diekmann, Heesterbeek and Metz (1990). Heesterbeek’s history traces the concept to demography, fully formed in Dublin and Lotka’s work of 1925, and notes it took until 1980 to mature in epidemiology. The threshold is the same as for K: below 1, an infection cannot keep growing.
Two lessons carry over. First, R0 is “cases per case”, not a rate, as Delamater and colleagues stress; speed needs the generation interval, just as K needs cycle time. Second, epidemiologists separate R0 from the effective reproduction number, which drops as fewer people remain susceptible. A product’s K behaves like the effective number.
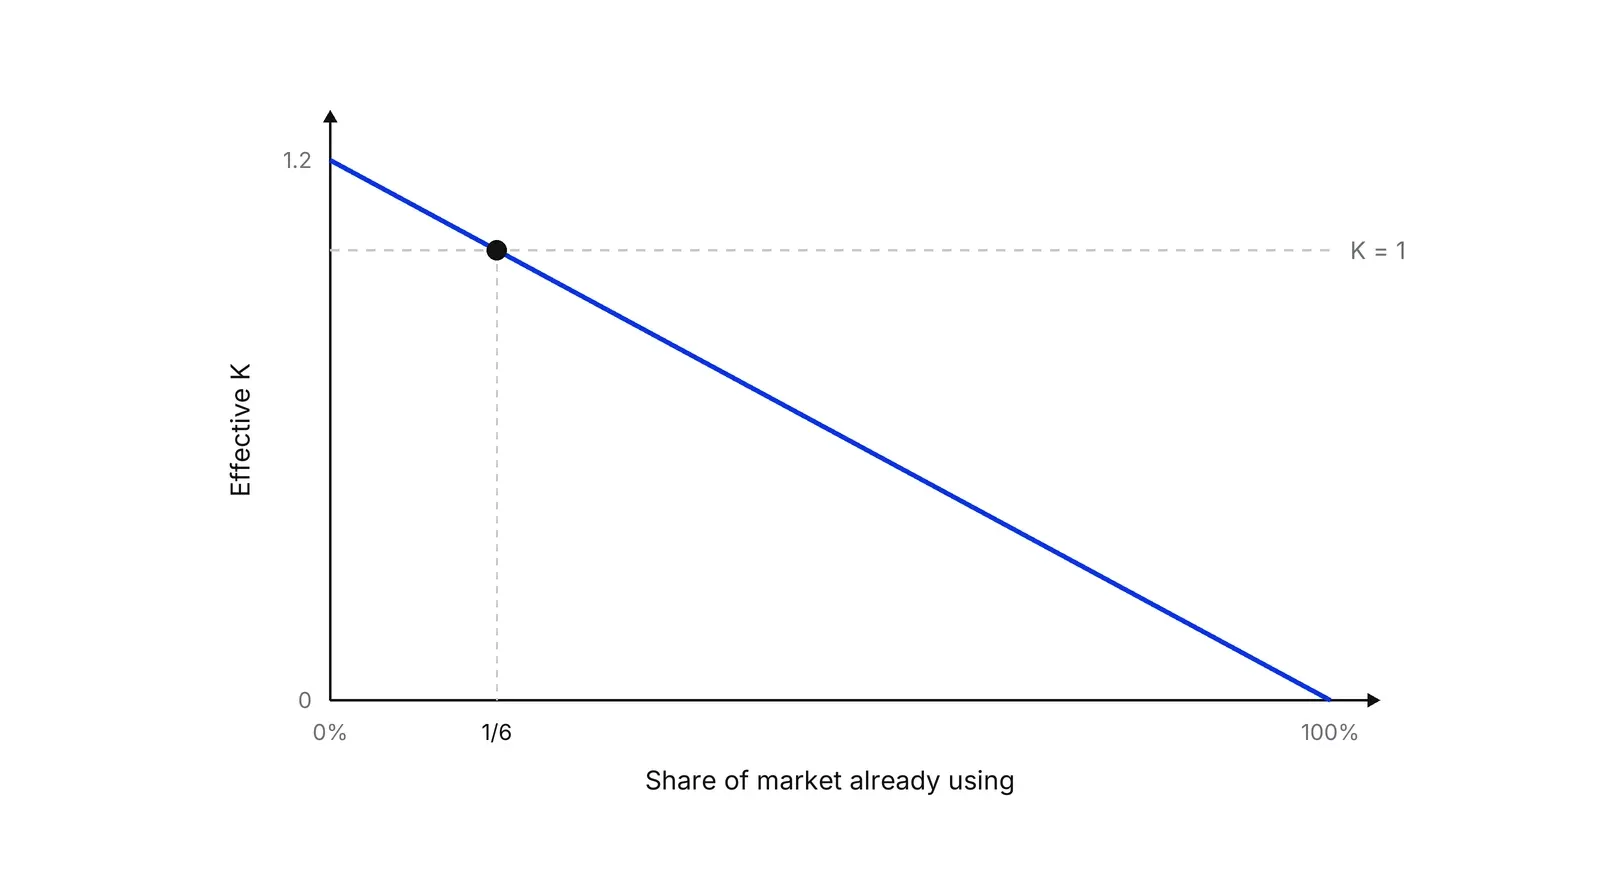
Chen described the same effect on Facebook apps: “as you saturate the network, the conversion rate on your invites goes down.” In a simple model, effective K = K x (share of the market not yet reached). With K = 1.2, effective K falls to 1 once one sixth of the market, about 16.7%, already uses the product. Kermack and McKendrick asked in 1927 whether an epidemic can end while many susceptible people remain. For a product, the answer matters: viral growth usually stalls well before the market is used up.
What research says about real virality
True viral spread is rare. Goel, Anderson, Hofman and Watts studied a billion diffusion events on Twitter and found that over 99% of cascades are tiny and end within one generation. Popularity was driven largely by the size of the largest single broadcast, not by long chains of sharing. A study of 16 million product recommendations by Leskovec, Adamic and Huberman found that recommendations, on average, “do not spread very far.”
The levers still work at the margin:
| Lever | Moves | What research found |
|---|---|---|
| Broadcast vs personal invites | i vs c | Aral and Walker: personal messages convert better per message, broadcast ones are sent more and win on total adoption |
| Referral rewards | i | Ryu and Feick: rewards raise referral likelihood most for weak ties and weaker brands |
| Who gets seeded | starting cohort and i | Hinz and colleagues: the best seeding strategy was up to eight times more successful, and well-connected seeds worked best |
| Product value vs reward | c | Biyalogorsky, Gerstner and Libai: delighted customers refer anyway, so rewards compete with lower price or higher value |
For forecasting a campaign, van der Lans and colleagues built a branching model, the same mathematics as K, that predicted the reach of a campaign with over 200,000 participants from its early data.
Formula or cohort ratio?
Practitioners disagree on how to measure K. Skok’s i x c is easy to diagnose, because it splits K into a sending problem and a converting problem. Chen’s 2025 essay rejects it as incomplete, since it misses users who arrive through shared documents, collaboration or copied links. He measures the users a cohort eventually brings in, divided by the cohort size. Use the cohort ratio as the number you report and i x c to decide what to fix. In Pushers’ Growth Lab, K sits in the growth model next to paid acquisition cost, because each one changes what the other is worth.
How to apply Viral coefficient (K-factor), step by step
- Pick one cohort and one window. Take every user who signed up in one week and follow them for a fixed window, such as 14 days. Using a cohort stops last month's heavy inviters from inflating this month's figure. Result: a fixed group of users and a fixed time window.
- Count invites per user (i). Divide all invites, shares and referral links sent by the cohort in the window by the cohort size. Count each unique recipient once, so a reminder email does not double the number. Result: i, for example 5 invites per user.
- Count conversion (c). Divide the number of recipients who signed up, or reached your activation event, by the number of unique recipients invited. Decide in advance whether a sign-up without activation counts; activation is the stricter and more useful choice. Result: c, for example 16%.
- Multiply and check against the cohort ratio. K = i x c. Then count the new users the cohort actually brought in, divided by the cohort size. If the two numbers differ a lot, your tracking misses a channel such as copied links or shared documents. Result: one K you trust.
- Measure the cycle time. Take the median number of days between a user signing up and their invitees signing up. This is the time one round of the loop takes. Result: cycle time in days, for example 7.
- Work out which lever is cheapest to move. Model what a 20% gain in i, in c or in cycle time does to users after 4 and 8 weeks. Pick the lever with the biggest effect per week of engineering work and test it. Result: one experiment with a forecast you can check.
Examples
A shared-calendar app below K = 1
Illustrative. 1,000 new users each send 5 invites in their first week and 16% of invitees join, so K = 0.8. The invited generations are 800, 640, 512 and 409.6 users, and four weeks bring the total to 3,361.6. Left alone, the cohort tends to five times its starting size. The app is not viral, but every paid sign-up is worth five.
A payments app where the paid budget does the seeding
Illustrative. A transfer app buys 1,000 users a week at $50 each, and each user's referrals give a K of 0.8. Once the loop settles, weekly sign-ups approach 1,000 / (1 - 0.8) = 5,000, so the blended cost per user falls from $50 to $10. Raising K to 0.9 would double weekly sign-ups again to 10,000 for the same spend.
Hotmail's footer link
Hotmail's investor Tim Draper pushed for a line at the foot of every outgoing email, which became 'Get your free email at Hotmail', according to Adam Penenberg's account. Every email a user sent was an invite, so i was simply the number of people each user wrote to. Draper and Steve Jurvetson used the case in a May 1997 essay naming the pattern viral marketing; earlier uses of the term are also reported.
When to use it
Use it when your product has a sharing, inviting or collaboration step that you can track: consumer apps, collaboration tools, marketplaces, payments and messaging products, and referral programs. It is most useful once a weekly cohort is large enough, a few hundred users, for i and c to stay stable from week to week.
When not to use it
Skip it when new customers come from sales calls, tenders or one-off purchases nobody shares, such as enterprise software or home repairs. Skip it too when you cannot tie a new user to the person who referred them: a K built on guesses about word of mouth will mislead more than it helps.
Common mistakes
- Treating K as fixed. As more of your market already uses the product, invites reach people who have already said yes or no, and K falls.
- Ignoring cycle time. A K of 1.2 on a 3.5-day cycle produces almost three times the users in 28 days that the same K produces on a 7-day cycle.
- Counting invites from all users ever, not from one cohort, which mixes old and new behaviour and overstates K.
- Counting sign-ups instead of activated users as conversions, so K looks healthy while invitees never use the product.
- Writing off a K below 1. A K of 0.5 doubles every user you acquire through other channels.
FAQ
How do you calculate the viral coefficient?
Multiply the average number of invites each user sends by the share of those invites that turn into new users. If each user sends 5 invites and 16% convert, K = 5 x 0.16 = 0.8. Measure both numbers on one cohort of users over a fixed window, such as their first 14 days.
What is a good viral coefficient?
Above 1 means each cohort of users recruits a larger one, which is rare and rarely lasts. Andrew Chen has written that a viral factor above 0.5 is enough to amplify other channels. In practice, any K that you can raise by a tenth through product changes is worth more than chasing a benchmark.
What is the difference between the K-factor and R0?
Both count how many new cases one case produces. R0 in epidemiology assumes everyone else is susceptible; the effective reproduction number accounts for people already immune. A product's K behaves like the effective number: it falls as more of the market already uses the product or has turned it down.
What is viral cycle time?
Viral cycle time is the time from one user signing up to the users they invited signing up. It decides how often K compounds. With K = 1.2, halving cycle time from 7 days to 3.5 days almost triples the users a cohort brings in over four weeks.
Can a product grow virally with a K below 1?
Not on its own. A cohort with K below 1 adds a shrinking number of users each cycle and stops at 1 / (1 - K) times its starting size. But combined with paid, sales or content channels, the same K multiplies their output, so a K of 0.8 makes every acquired user worth five.
Sources
- David Skok, Lessons Learned: Viral Marketing, For Entrepreneurs
- Andrew Chen, Facebook viral marketing: When and why do apps jump the shark?, 2008
- Andrew Chen, The lost art of designing viral loops, a16z speedrun, 2025
- Eric Ries, The three drivers of growth for your business model, Startup Lessons Learned, 2008
- Steve Jurvetson, on the original 1997 viral marketing article with Tim Draper, 2013
- TechCrunch, PS: I Love You. Get Your Free Email at Hotmail (excerpt from Adam L. Penenberg, Viral Loop), 2009
- W. O. Kermack, A. G. McKendrick, A Contribution to the Mathematical Theory of Epidemics, Proceedings of the Royal Society A 115, 1927
- O. Diekmann, J. A. P. Heesterbeek, J. A. J. Metz, On the definition and the computation of the basic reproduction ratio R0, Journal of Mathematical Biology 28, 1990
- J. A. P. Heesterbeek, A brief history of R0 and a recipe for its calculation, Acta Biotheoretica 50, 2002
- Paul L. Delamater et al., Complexity of the Basic Reproduction Number (R0), Emerging Infectious Diseases 25(1), 2019
- Jacco Wallinga, Marc Lipsitch, How generation intervals shape the relationship between growth rates and reproductive numbers, Proceedings of the Royal Society B 274, 2007
- Sharad Goel, Ashton Anderson, Jake Hofman, Duncan J. Watts, The Structural Virality of Online Diffusion, Management Science 62(1), 2016
- Jure Leskovec, Lada Adamic, Bernardo Huberman, The Dynamics of Viral Marketing, ACM Transactions on the Web 1(1), 2007
- Ralf van der Lans, Gerrit van Bruggen, Jehoshua Eliashberg, Berend Wierenga, A Viral Branching Model for Predicting the Spread of Electronic Word of Mouth, Marketing Science 29(2), 2010
- Oliver Hinz, Bernd Skiera, Christian Barrot, Jan U. Becker, Seeding Strategies for Viral Marketing, Journal of Marketing 75(6), 2011
- Sinan Aral, Dylan Walker, Creating Social Contagion Through Viral Product Design, Management Science 57(9), 2011
- Kyoungmi Ryu, Lawrence Feick, A Penny for Your Thoughts: Referral Reward Programs and Referral Likelihood, Journal of Marketing 71(1), 2007
- Eyal Biyalogorsky, Eitan Gerstner, Barak Libai, Customer Referral Management: Optimal Reward Programs, Marketing Science 20(1), 2001
- Duncan Watts, Jonah Peretti, Viral Marketing for the Real World, Harvard Business Review, 2007
- V. Kumar, J. Andrew Petersen, Robert P. Leone, How Valuable Is Word of Mouth?, Harvard Business Review, 2007
- Philipp Schmitt, Bernd Skiera, Christophe Van den Bulte, Referral Programs and Customer Value, Journal of Marketing 75(1), 2011
- Frank M. Bass, A New Product Growth Model for Consumer Durables, Management Science 15(5), 1969
- Raghuram Iyengar, Christophe Van den Bulte, Thomas Valente, Opinion Leadership and Social Contagion in New Product Diffusion, Marketing Science 30(2), 2011
Last updated Oct 9, 2026


Marketing agency or growth system: when a company outgrows its agency
An agency is the right call while the founder still runs most of the company. Once the business starts copying itself into new locations or markets, it needs a system that sets goals, tests hypotheses and owns the result.

Why healthcare marketing agencies stall: the short, mid and long wins model we use with clinics
Most agencies own the click and nobody owns the front desk. How we structure clinic work in three horizons, the research behind each one, and one year of results.

Why channel tests stall after month three
Most paid channel tests do not end with a decision. They end when the budget runs out, the attribution model changes, or everyone quietly stops looking at the dashboard.