Profit and loss statement (P&L)
A profit and loss statement lists a business's revenue and costs for a period, step by step, down to the profit left at the bottom.
A profit and loss statement (P&L, also called an income statement) is a financial report that shows a company's revenue and expenses over a period, such as a month or a year, and the profit or loss that remains. It reads from the top down: revenue, direct costs, operating expenses, financing costs, tax, and net profit.
- Origin
- Accounting practice; presentation rules set by the IASB (IFRS) and the FASB (US GAAP), IFRS 18 issued April 2024
- Level
- 201 · Tool
- Fits
- Startup, Small and mid-size, Scale-up
- Time to apply
- About an hour to rebuild a month of your own P&L and read it line by line
- What you need
- revenue and expense totals for one month or quarter, from your accounting system · the split of costs between direct costs, sales and marketing, and general overhead · last period's P&L, or the budget, for comparison
A profit and loss statement is a report of what a business earned and what it spent over one period, with profit or loss at the bottom. It is also called an income statement, and in Russian-language practice the same report is often searched as ОПиУ. The US Securities and Exchange Commission describes it as a staircase: sales at the top, then costs deducted step by step until net income is left (SEC).
There is no single inventor. The layout grew out of bookkeeping practice and is now fixed by standard setters: the IASB for IFRS, the FASB and the SEC for US companies, and national ministries elsewhere. Founders read it to see whether the business makes money, and marketers read it to see where their budget sits and what it has to earn back.
The ladder: from revenue to net profit
A P&L is a sequence of subtotals, and each subtotal answers a different question. The multi-step layout used in most management reporting runs: net sales, minus cost of goods sold, gives gross margin; minus operating expenses, split into selling expenses such as advertising and general and administrative expenses, gives income from operations; interest, tax and other items then lead to net income (OpenStax).
Read it in layers. Gross profit tells you whether the product or service pays for itself. Operating profit tells you whether the business as a whole does, after sales, marketing and overhead. Net profit is what remains for owners after financing and tax.
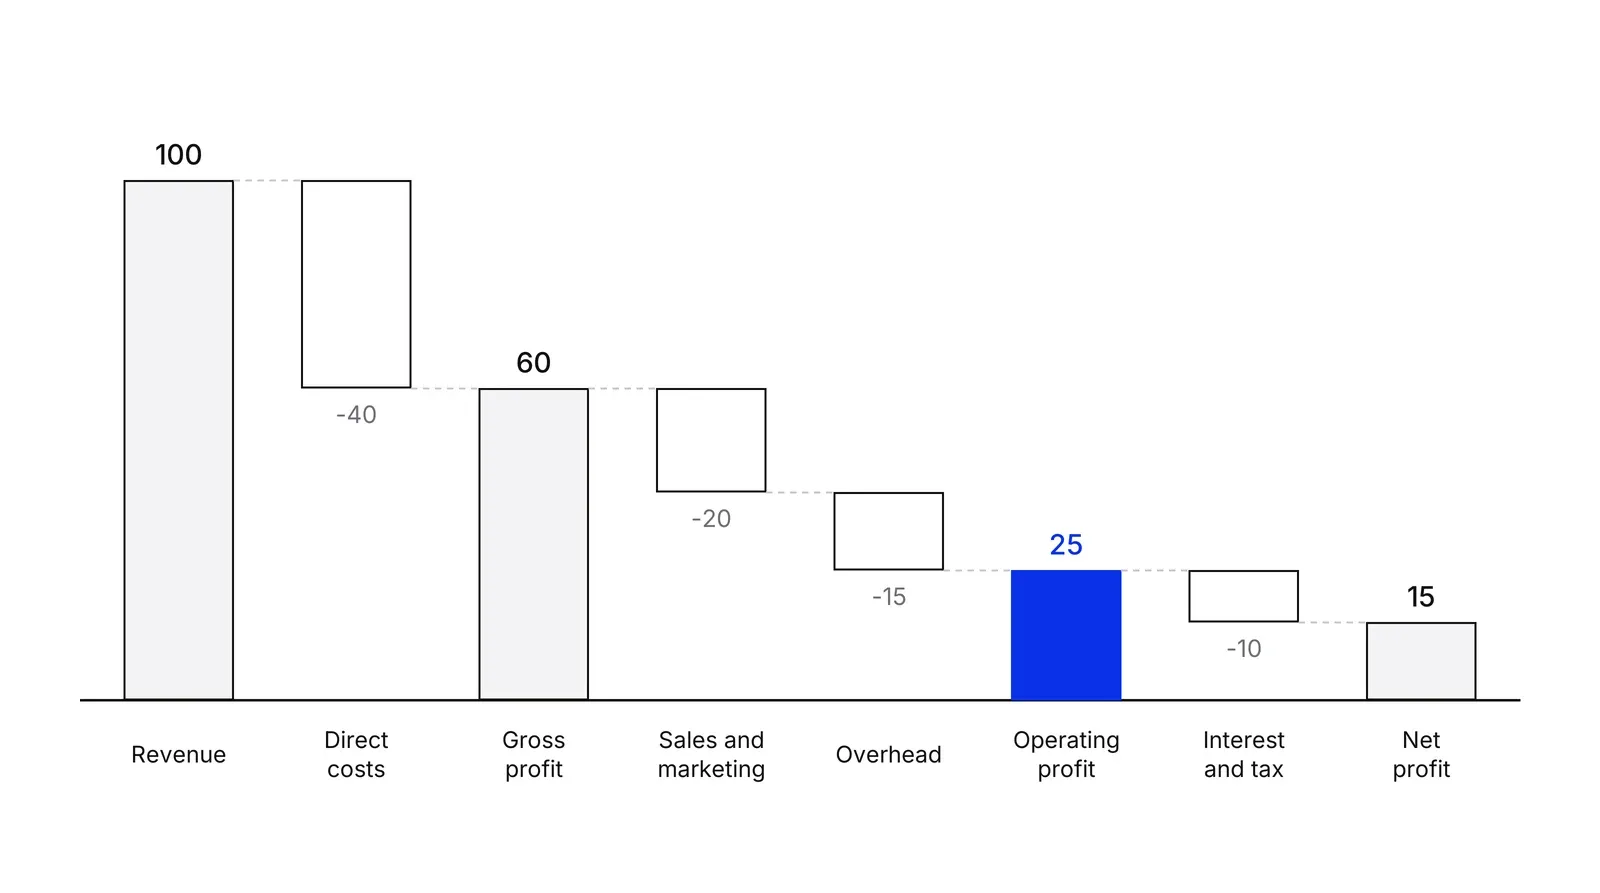
US companies filing with the SEC follow a similar order under Regulation S-X: sales and revenues, costs applicable to them, other operating costs, selling, general and administrative expenses, non-operating items, income before tax, tax, and net income (17 CFR 210.5-03).
Where marketing sits, and what the rules say about timing
Marketing spend normally lands in operating expenses, in a selling or sales and marketing line. That is why it does not reduce gross profit but does reduce operating profit.
Timing matters more than the line. Under IFRS, advertising is expensed as incurred, and a prepayment is an asset only until the entity has the right to access the goods or services. Under US GAAP, most advertising can be expensed as incurred or when it first runs, and qualifying direct-response advertising may be capitalized (PwC Viewpoint). The IFRS Interpretations Committee applied the same logic to promotional goods: they are an expense once the company owns them, not once they are handed out (IFRIC agenda decision).
Sales commissions work differently in the US. Incremental costs of obtaining a contract, with commissions the usual case, must be capitalized if they will be recovered, unless the amortization period is one year or less (Deloitte). The practical result for a marketer: the cost on the P&L and the cash you spent are different numbers, and a customer acquisition cost built from the P&L may differ from one built from the bank statement.
P&L, balance sheet and cash flow
The three reports are often mixed up, and searches such as “balance and ОПиУ” show it.
| P&L | Balance sheet | Cash flow statement | |
|---|---|---|---|
| Question | Did the period make a profit? | What does the business own and owe? | Where did the cash come from and go? |
| Time frame | A period | One date | A period |
| Counts | Revenue and costs when earned and incurred | Assets, liabilities, equity | Actual cash in and out |
A growing company can show a profit and still run short of cash, because revenue is recorded when earned and costs when incurred, not when money moves.
What IFRS 18 changes from 2027
IFRS 18 was issued in April 2024 and replaces IAS 1. It applies to annual periods beginning on or after 1 January 2027, with earlier use permitted (IFRS Foundation), and it is applied retrospectively, so prior-period comparatives are restated (BDO).
Every item goes into one of five categories: operating, investing, financing, income taxes and discontinued operations. Operating is the residual: whatever is not required to sit elsewhere (ACCA). Three subtotals become mandatory: operating profit, profit before financing and income taxes, and profit. Gross profit is optional.
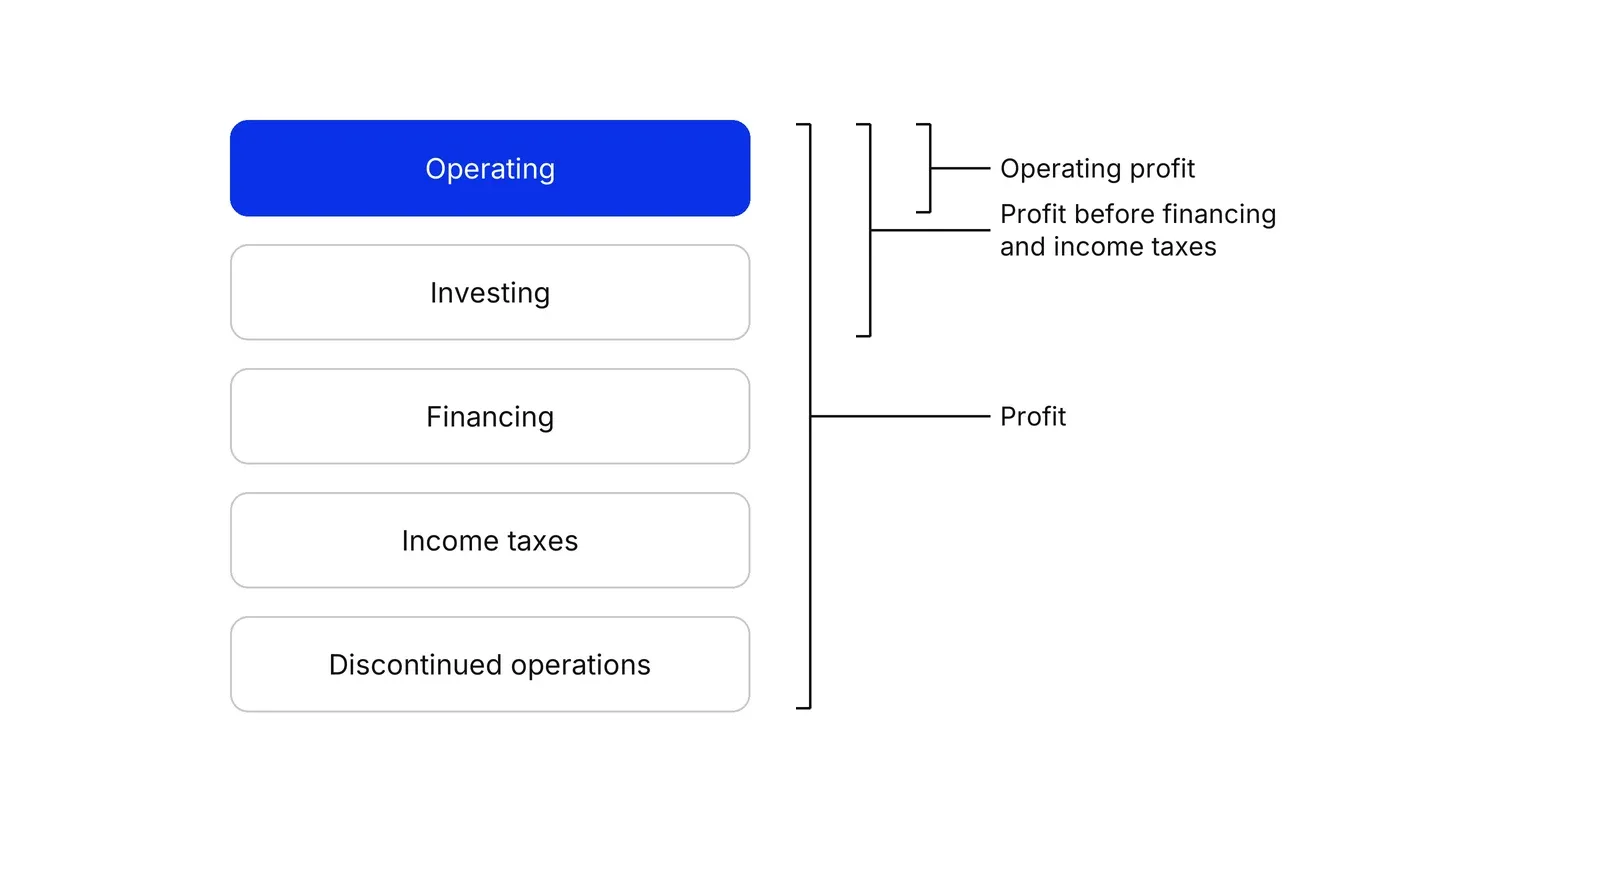
Two further changes touch marketers. Operating expenses can be shown by nature, by function or mixed, and the analysis now has to appear on the face of the statement, not only in the notes (BDO Australia). And company-defined profit measures, such as adjusted EBITDA, must be explained and reconciled to an IFRS subtotal in a single note (RSM). In the US, the FASB’s separate expense-disaggregation standard, ASU 2024-03, applies to public companies from annual periods beginning after 15 December 2026 and adds footnote detail without changing the face of the statement (Deloitte).
The Russian form
In Russia the statutory report is called “Отчёт о финансовых результатах” (form 0710002). The long-standing forms came from Order No. 66n of 2010 (ConsultantPlus). FSBU 4/2023 applies from statements for 2025, and the forms are now samples attached to the standard (ConsultantPlus). The sample runs: revenue, cost of sales, gross profit, selling expenses, administrative expenses, profit from sales, interest, other income and expenses, profit before tax, income tax, and net profit (ConsultantPlus). Selling expenses are the line where advertising normally sits.
Reading it as a marketer
Rebuild the P&L in a spreadsheet and turn each line into a percentage of revenue, as HBR advises (HBR). Then ask three questions: how much of revenue is gross profit, how much of gross profit does sales and marketing take, and how much remains as operating profit. Per-unit views belong to contribution margin, and a KPI tree connects the P&L lines to the metrics each team owns.
Treat adjusted profit with care. HBR documented firms that excluded marketing costs from adjusted operating income, treating them as investments rather than expenses (HBR). In the US, the SEC requires a reconciliation to the nearest GAAP measure, shown with equal or greater prominence (Deloitte).
A Growth Lab plan starts from the P&L lines that a growth budget can actually move.
How to apply Profit and loss statement (P&L), step by step
- Fix the period and the basis. Choose one month or quarter and confirm the figures are on an accrual basis, meaning costs sit in the period they relate to, not the period you paid. Result: a P&L that matches the work done in the period, not the movement of cash.
- Lay out the ladder. List revenue, direct costs, gross profit, operating expenses, operating profit, financing costs, tax and net profit in that order, with a subtotal after each group. Result: one page where each profit figure can be traced to the lines above it.
- Place marketing in the right lines. Put media spend, agency fees, and the marketing and sales team in one sales and marketing line, and keep production costs of the product itself in direct costs. Result: a marketing cost you can divide by new customers to get acquisition cost.
- Turn every line into a percentage of revenue. Divide each line by revenue. Result: a column of ratios, such as gross margin or sales and marketing as a share of revenue, that can be compared across months and with similar businesses.
- Compare with last period and the budget. Mark each line that moved by more than a threshold you set, for example 10 percent. Result: a short list of lines that need an explanation instead of a page of numbers.
- Reconcile any adjusted profit figure. If your team uses an adjusted profit such as EBITDA, write down every item added back to reach it from the reported operating profit. Result: a figure that anyone can rebuild from the statement.
Examples
A payments company reading its month
Illustrative, per 100 of fee revenue. Network and bank fees take 40, leaving 60 of gross profit. Marketing and sales take 20 and compliance, finance and management take 15, so operating profit is 25. After 10 of interest and tax, net profit is 15. A better network fee deal moves gross profit directly, while a cut in ad spend moves only the marketing line.
A clinic that prepays its advertising
Illustrative. A clinic pays for a three-month campaign in January, and the campaign runs February to April. Cash falls by the full amount in January, but the P&L carries one third of the cost in each of the three months as the advertising is received. January looks profitable on the P&L and weak in the bank account, which is why the two reports are read together.
A software company paying sales commissions
Illustrative. A software company pays a commission equal to 10 percent of a three-year contract. Under the US GAAP rule for contract costs (ASC 340-40, as summarised by Deloitte) an incremental cost like this is generally recorded as an asset and expensed over the period the contract benefits. The P&L therefore shows only a fraction of the commission in the signing month, while the cash left in full.
When to use it
Use it every month for any business that has revenue and costs, and before any decision about hiring, ad budgets or pricing. It is the starting point for margin analysis, budgeting and conversations with investors and lenders.
When not to use it
Do not use it alone to judge liquidity or survival. A profitable P&L can sit next to an empty bank account, and the balance sheet and cash flow statement answer those questions. It also says little about the profit of a single customer or product, where contribution margin is the sharper tool.
Common mistakes
- Reading the P&L as a cash report. Revenue is recorded when earned and costs when incurred, so profit and cash move apart, especially with prepayments, annual contracts and capitalized commissions.
- Hiding marketing inside general overhead. When media spend, agency fees and sales salaries are not in one line, acquisition cost cannot be calculated and the marketing budget cannot be compared with revenue.
- Trusting an adjusted profit without the reconciliation. HBR reports that some companies excluded marketing costs from adjusted profit measures, which makes a loss look better than it is.
- Comparing gross margin across companies that classify costs differently. One firm puts support staff in direct costs, another in operating expenses, so the same business can show very different gross profit.
- Looking at one month in isolation. A single month carries timing effects, so read at least three months and the same month a year earlier.
FAQ
What is a profit and loss statement in simple terms?
It is a report of what a business earned and spent over a period, and what was left. It starts with revenue, subtracts costs in stages, and ends with net profit. The SEC describes it as a staircase from sales down to net income.
What is the difference between a P&L and a balance sheet?
A P&L covers a period of time, such as a quarter, and shows revenue, costs and profit. A balance sheet is a snapshot on one date of what the business owns and owes. Profit from the P&L flows into the equity side of the balance sheet.
Where do marketing expenses go on a P&L?
Advertising and the marketing team usually sit in operating expenses, often in a line called selling and marketing. The OpenStax accounting text lists advertising under selling expenses. Under IFRS, advertising is expensed when the services are received, not when paid.
What is a management P&L and how does it differ from the statutory one?
A management P&L is the version a company builds for its own decisions, with the cost groups it finds useful, for example by product or channel. The statutory P&L follows set rules and layouts for filing. The two should reconcile to the same total profit.
What changes in the P&L under IFRS 18?
IFRS 18 replaces IAS 1 for annual periods starting on or after 1 January 2027. It requires five categories, two new defined subtotals, operating profit and profit before financing and income taxes, and a note for company-defined measures such as adjusted EBITDA.
Sources
- IFRS Foundation, IFRS 18 Presentation and Disclosure in Financial Statements
- IFRS Foundation, Primary Financial Statements project
- IFRS Foundation, IAS 1 Presentation of Financial Statements
- ACCA, IFRS 18 technical article
- BDO UK, IFRS 18 series, part 1: classification of income and expenses
- BDO Australia, presenting operating expenses under IFRS 18 by nature, by function or both
- RSM UK, IFRS 18: understanding management-defined performance measures
- Deloitte Middle East, Understanding IFRS 18
- Deloitte DART, FASB clarifies effective date of ASU 2024-03 (disaggregation of income statement expenses)
- U.S. SEC, Beginners' Guide to Financial Statements
- Cornell Law School LII, 17 CFR 210.5-03, income statements (Regulation S-X)
- OpenStax, Financial Accounting, 6.6 multi-step and simple income statements
- ConsultantPlus, Order of the Russian Ministry of Finance No. 66n of 02.07.2010 on forms of accounting statements
- ConsultantPlus, sample statement of financial results (form 0710002) under FSBU 4/2023
- ConsultantPlus, FSBU 4/2023 applies to statements for 2025
- PwC Viewpoint, IFRS and US GAAP: advertising costs
- IFRS Interpretations Committee, agenda decision: goods acquired for promotional activities (IAS 38), September 2017
- Deloitte DART, Revenue recognition: accounting for costs of obtaining a contract (ASC 340-40)
- Harvard Business Review, Improve your finance skills by learning to read your company's income statement
- Harvard Business Review, Mind the GAAP
- Deloitte DART, Regulation G and Item 10(e): general requirements for non-GAAP measures
Last updated Oct 9, 2026


How to calculate channel payback and unit economics
A CAC number that only marketing believes will not survive a finance review. This guide calculates channel payback so both teams work from the same model.

Fractional CFO vs finance operations: which gap do you actually have
A fractional CFO is a person. Finance operations is a system. Companies searching for one are often missing the other, or both.