Growth model
A growth model is a small set of equations, usually a spreadsheet, that calculates an output metric such as active customers or revenue from the input metrics a team can change, so you can see which lever moves the result most.
A growth model is a quantitative model, usually a spreadsheet, that calculates an output metric such as active customers or revenue from input metrics a team controls: traffic, conversion, retention and referrals. It comes from two traditions, Amazon's controllable input metrics and the Reforge growth models built by Brian Balfour and colleagues, and it shows which input moves the output most.
- Origin
- Amazon (controllable input metrics, described by Colin Bryar and Bill Carr); Brian Balfour, Casey Winters and Kevin Kwok at Reforge (quantitative growth models), Amazon practice from the 2000s, book 2021; Balfour deck 2015, Reforge 2018
- Level
- 301 · Advanced
- Fits
- Startup, Scale-up
- Time to apply
- A day for a first spreadsheet, then a monthly update against actual numbers
- What you need
- twelve months of history for traffic by channel, conversion steps, retention and revenue, or honest estimates where data is missing · one output metric the leadership team has agreed on · a spreadsheet and one person who owns the model and updates it monthly
A growth model is a set of equations, usually kept in a spreadsheet, that calculates an output metric from input metrics. The output is the result the business cares about: active customers, processed volume, revenue. The inputs are the things teams can change: traffic from each channel, conversion at each step, retention, referrals. Once the model exists, you can change one input and see how far the output moves.
The idea has two roots. Amazon built its management system around what it calls controllable input metrics, described by Colin Bryar and Bill Carr, who spent 27 years between them as senior Amazon executives, in their 2021 book Working Backwards. In startups, Brian Balfour’s 2015 talk laid out weekly active users as a formula of channels, activation and retention, and Reforge turned growth modeling into a course in 2018. The maths is older still: Frank Bass published a growth model for new products in Management Science in 1969.
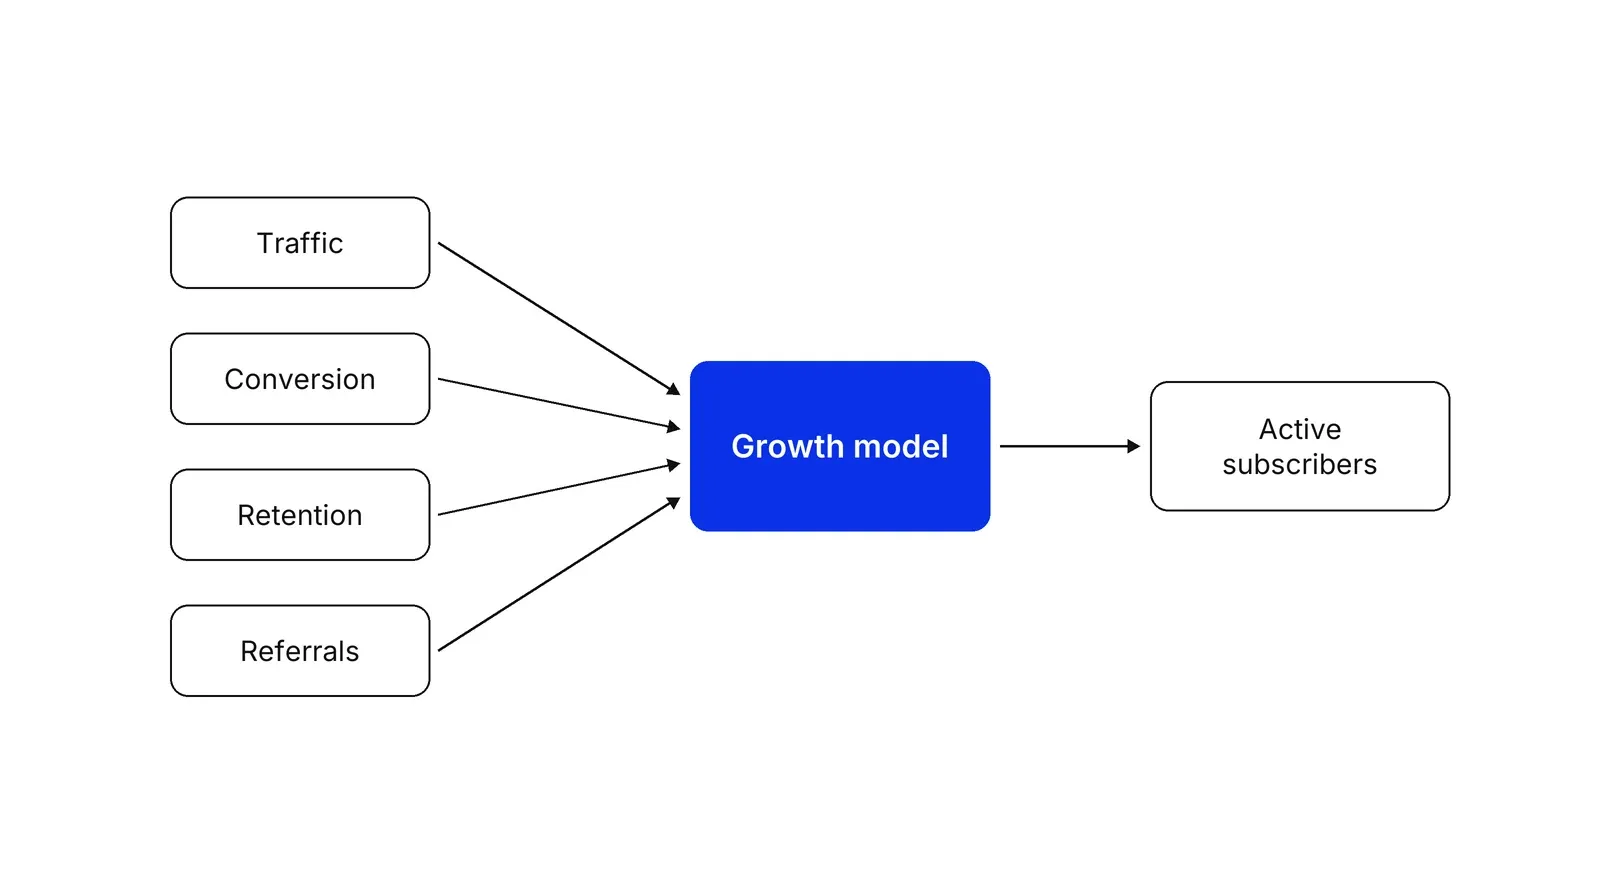
Output metrics and input metrics
An output metric records a result, and nobody can change it directly. Revenue, profit, active customers and share price are outputs. An input metric is a driver that a team can act on this week: how many products are in stock, how fast orders arrive, what share of trial users convert. The Working Backwards site calls outputs lagging indicators that “measure the results of the inputs.”
The test is simple. Ask the owner what they will do on Monday to move the number. If the honest answer is “work harder on everything,” it is an output. If the answer names an action, such as restocking the fifty most searched items, it is an input.
This is an old management concern. Kaplan and Norton opened The Balanced Scorecard in 1992 by warning that financial measures alone give misleading signals for continuous improvement. A growth model adds the arithmetic that links the drivers to the financial line.
How Amazon picks controllable inputs
Amazon treats the inputs as the work and the outputs as the scorecard. In the 2009 shareholder letter, Jeff Bezos wrote that new senior leaders are often surprised how little time the company spends discussing financial results. Of the 452 goals Amazon set for 2010, 360 had a direct impact on customer experience, and the terms net income, gross profit and operating profit did not appear once.
Choosing the right input takes several tries. Bryar and Carr’s best-known story, retold by Holistics, is about selection. Teams were first measured on new product detail pages created. They added items in bulk, sales did not rise, and some bought products nobody wanted. The metric moved to detail page views, then to the share of views where the item was in stock, and finally to the share where it was in stock and ready for two-day shipping, which Amazon called Fast Track In Stock. Each version was checked against one question: does moving this number move sales?
The review matters as much as the choice. Cedric Chin’s summary of the book describes the Weekly Business Review, where every metric has an owner and finance audits the numbers, so owners cannot pick flattering ones.
What does a growth model spreadsheet look like?
A growth model spreadsheet has months in columns, inputs in rows and one identity that ties them together. Balfour’s version: weekly active users equal new activated users plus retained users, and new activated users equal registrations times activation rate, summed over channels. Phiture’s William Gill puts the rule plainly: “Growth Models are about inputs, not outputs.” Growth rate is something the model calculates, never something you type in.
Take an online physiotherapy app, with illustrative numbers laid out the way Gill’s guide suggests: acquisition, then retention by cohort, then loops. It has 2,000 paying subscribers. Each month it gets 30,000 site visitors, 4% start a trial, 30% of trials pay, 90% of subscribers stay, and each subscriber brings 0.02 new ones through referrals. New paying subscribers from the funnel: 30,000 × 4% × 30% = 360 a month.
| Month | Retained (90%) | From funnel | Referrals (2%) | Subscribers |
|---|---|---|---|---|
| Start | 2,000 | |||
| 1 | 1,800 | 360 | 40 | 2,200 |
| 2 | 1,980 | 360 | 44 | 2,384 |
| 3 | 2,146 | 360 | 48 | 2,553 |
| 12 | 3,581 |
The model also shows a ceiling, the steady state that system dynamics calls equilibrium. Growth stops when the 360 new subscribers equal net losses, which happens at 360 / (10% churn − 2% referrals) = 4,500 subscribers. No amount of effort inside this setup gets past that number without changing an input.
Which input matters most?
The sensitivity test answers this: change each input by the same amount and compare. In the physiotherapy model, raise traffic by 10%, or cut churn from 10% to 9%, or lift referrals from 2% to 2.2%.
| Change | Extra subscribers, month 12 | Extra subscribers, month 36 | New ceiling |
|---|---|---|---|
| Traffic +10% | +285 | +428 | 4,950 |
| Churn 10% to 9% | +246 | +537 | 5,143 |
| Referrals 2% to 2.2% | +48 | +99 | 4,615 |
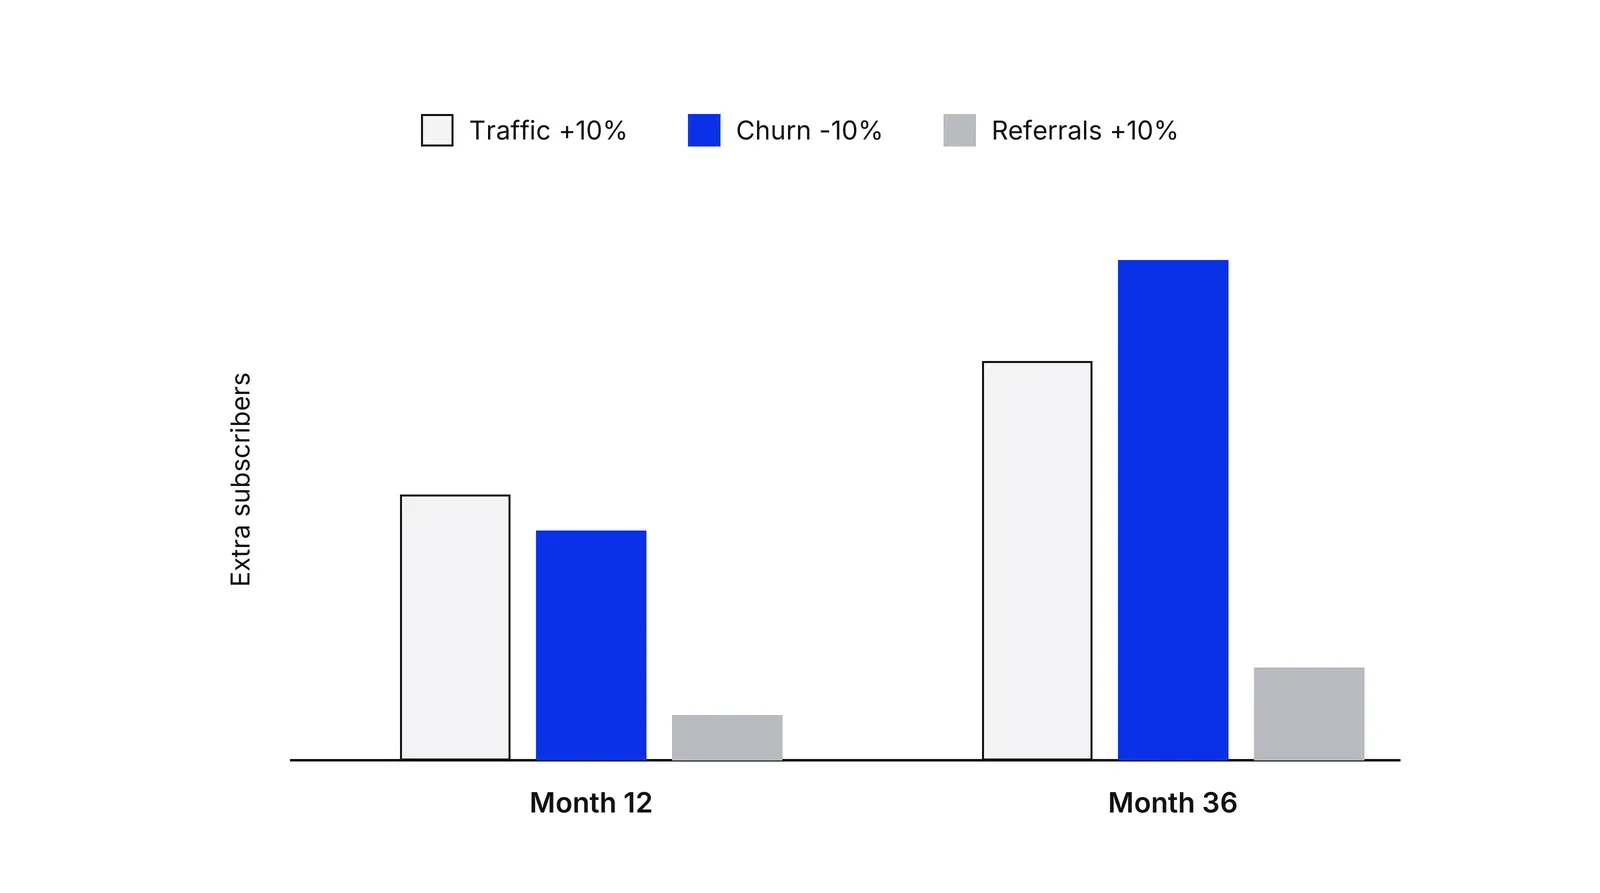
The answer depends on the horizon. Traffic wins at month 12; lower churn wins at month 36 and sets a higher ceiling. Traffic, trial rate and paid conversion multiply each other, so a 10% gain in any one of them gives the same +285.
Duolingo ran this test on its real data. Its growth model sorts learners into seven daily states, and the team simulated a small change in each transition rate. Jorge Mazal wrote that current user retention had about five times the impact on daily active users of the second-best lever. The sources differ on the result: Mazal reports 4.5 times DAU growth over four years, while the Duolingo blog says DAU grew four times since 2019.
Keeping inputs honest
An input that a team can inflate without helping customers will be inflated, as Amazon’s detail page count showed. Choi, Hecht and Tayler found in experiments that managers paid on a single measure were most likely to treat the measure as the goal itself.
Three habits help. Andy Grove’s High Output Management recommends paired indicators, one for the effect and one for the counter-effect, such as inventory level next to stock shortages. Kohavi, Tang and Xu’s book on experiments separates goal, driver and guardrail metrics, which maps onto output, input and counter-metric. And Amazon’s own fix was to redefine the input until moving it moved sales.
Growth model, North Star, KPI tree, growth accounting
These tools are often confused because they all connect numbers. The difference is the question each one answers.
| Tool | Question it answers | Direction |
|---|---|---|
| Growth model | If we change this input, what happens to the output? | Forward, with rates |
| North Star Metric | Which single number best reflects customer value? | One metric and its inputs |
| KPI tree | Who owns which number, and how do they add up? | Structure, no forecast |
| Growth accounting | Why did last month’s number change? | Backward, from actuals |
| Growth loops | How does one cohort of users produce the next? | Qualitative map of compounding |
In practice they work together: the North Star or revenue sits at the top, the KPI tree assigns owners, growth accounting explains each month, and the growth model tells you where next quarter’s effort should go. In Pushers’ Growth Lab the model is the step between the KPI tree and the backlog of experiments, since every hypothesis should name the input it is meant to move.
How to apply Growth model, step by step
- Pick the output. Choose the one number the model must explain, such as active subscribers, monthly processed volume or revenue. It should be the number the board already reviews. Result: one output metric with a written definition.
- Write the identity. Break the output into the parts that add or multiply to it: this month's active customers equal last month's retained customers plus new ones from each channel plus referrals. Check that the equation reproduces last year's actual numbers. Result: a formula that balances against history.
- Name the inputs and their owners. Every term in the formula becomes an input metric with one owner: traffic by channel, conversion rate per step, monthly retention, referral rate. Test each one by asking whether a team can change it this month. Result: five to ten inputs, each with an owner and a current baseline.
- Run the sensitivity test. Change each input by the same amount, for example 10%, and record how much the output moves at 12 and 36 months. Note the ceiling each input can realistically reach. Result: a ranked list of levers and the horizon over which each one pays.
- Set goals on inputs. Give each team a target on its input, not on the output, and add a counter-metric for any input that can be gamed. Result: quarterly goals that add up, through the model, to the output the business needs.
- Compare forecast with actuals monthly. Each month, replace estimates with real numbers and look at where the model was wrong. A wrong rate is a finding about the business, not a spreadsheet error. Result: a model that gets more accurate every month and a list of assumptions to test.
Examples
Amazon and the detail page metric
When Amazon expanded beyond books, selection was a key input, and teams were first measured on the number of new product detail pages they created. According to Working Backwards, as summarised by Holistics, teams added large numbers of items and sales did not rise; some bought products with little demand. Amazon changed the metric step by step: detail page views, then the share of views where the item was in stock, then the share of views where it was in stock and ready for two-day shipping, called Fast Track In Stock.
Duolingo finds its biggest lever
Duolingo sorted every learner into daily states such as new, current, at-risk and dormant, with retention rates as the arrows between them. Jorge Mazal, its former chief product officer, wrote that the team moved each rate by 2% per quarter in simulations over three years. Current user retention rate had about five times the impact on daily active users of the next best lever, so a team was set up to work on it.
A B2B payments platform
Illustrative numbers. A payments company's output is monthly processed volume. Inputs: 50 new merchants signed a month, 60% of them processing within 14 days, $40,000 average monthly volume per active merchant, 3% of active merchants lost each month. The model shows 30 newly active merchants a month, a ceiling of 1,000 active merchants (30 divided by 3%) and $40 million a month at that ceiling. Cutting merchant churn to 2.5% lifts the ceiling by a fifth, to 30 divided by 2.5%.
When to use it
Use it when the team argues about where to put next quarter's budget, when the board asks for a forecast with reasons behind it, or when every team reports progress and the top-line number still does not move. It is worth building once a product has enough history to estimate retention and conversion.
When not to use it
Skip a detailed model before product-market fit, when retention is not yet stable and every rate is a guess. It also adds little for a business that grows through a few large contracts a year; a sales pipeline review answers those questions better than a rate-based model.
Common mistakes
- Typing in a growth rate, such as 15% a month, instead of calculating growth from channels, conversion and retention. Phiture's William Gill calls this the classic error.
- Choosing inputs that teams can inflate without helping customers, such as pages created or emails sent, and never checking whether they move the output.
- Judging levers over one quarter only. Acquisition shows up fast; retention shows up later and is often larger.
- Letting the model drift from reality. If nobody compares forecast with actuals each month, the spreadsheet becomes a wish list.
- Building a model with dozens of inputs nobody owns. Every input needs one person who can move it.
FAQ
What is a growth model in business?
A growth model is a set of equations, usually a spreadsheet, that calculates an output metric such as active users or revenue from inputs a team controls, such as traffic, conversion, retention and referrals. Its purpose is to show which input moves the output most and to set goals on those inputs.
What is the difference between input and output metrics?
Output metrics record results, such as revenue, profit or active customers, and teams cannot change them directly. Input metrics are the drivers a team can act on this week, such as in-stock rate, delivery time or trial conversion. Amazon calls them controllable input metrics; elsewhere they are often called leading indicators.
How do you build a growth model in Excel or Google Sheets?
Put months in columns and inputs in rows. Write the identity: this month's customers equal last month's customers times retention, plus new customers from each channel, plus referrals. Fill in actual history, check the formula reproduces it, then project forward and change one input at a time to see what moves the output.
Is a business growth model the same as an economic growth model?
No. Economic growth models, such as Robert Solow's 1956 model, explain the long-run growth of a national economy through capital, labour and technology. A business growth model explains one company's customers or revenue through its own inputs. The shared word is the only link; the methods and data differ.
What are controllable input metrics at Amazon?
They are the measures Amazon teams can change directly that drive results such as revenue, for example selection, in-stock rate and delivery speed. Jeff Bezos's 2009 shareholder letter says Amazon spends its energy on controllable inputs, and the 2021 book Working Backwards by Colin Bryar and Bill Carr describes how the metrics are chosen and reviewed weekly.
Sources
- Amazon.com, 2009 Letter to Shareholders, SEC filing EX-99.1
- Colin Bryar, Bill Carr, Working Backwards: Insights, Stories, and Secrets from Inside Amazon, St. Martin's Press, 2021, book site
- Working Backwards (Bryar and Carr), Input metrics
- Holistics, Huy Nguyen, How Amazon uses input metrics
- Commoncog, Cedric Chin, Book summary: Working Backwards
- Brian Balfour, Building a growth machine, slide deck, 2015
- Phiture, William Gill, How to build a growth model, 2017
- Reforge, Brian Balfour, Casey Winters, Kevin Kwok, Andrew Chen, Growth loops are the new funnels, 2018
- Casey Winters, Announcing the next Retention Deep Dive, Growth Series and something new, 2018
- Duolingo blog, Erin Gustafson, Meaningful metrics: how data sharpened the focus of product teams, 2023
- Lenny's Newsletter, Jorge Mazal, How Duolingo reignited user growth, 2023
- Amplitude, John Cutler, North Star inputs and flywheels, webinar
- Robert S. Kaplan, David P. Norton, The Balanced Scorecard: Measures That Drive Performance, Harvard Business Review, January-February 1992
- John D. Sterman, Business Dynamics: Systems Thinking and Modeling for a Complex World, Irwin/McGraw-Hill, 2000, Internet Archive record
- MIT Sloan School of Management, John D. Sterman faculty profile
- Frank M. Bass, A New Product Growth for Model Consumer Durables, Management Science 15(5), 1969
- Robert M. Solow, A Contribution to the Theory of Economic Growth, Quarterly Journal of Economics 70(1), 1956
- Ron Kohavi, Diane Tang, Ya Xu, Trustworthy Online Controlled Experiments, Cambridge University Press, 2020
- Andrew S. Grove, High Output Management, Random House, 1983, Internet Archive record
- Jongwoon Choi, Gary Hecht, William B. Tayler, Lost in Translation: The Effects of Incentive Compensation on Strategy Surrogation, The Accounting Review 87(4), 2012
- Michael Harris, Bill Tayler, Don't Let Metrics Undermine Your Business, Harvard Business Review, September-October 2019
Last updated Oct 9, 2026


Marketing agency or growth system: when a company outgrows its agency
An agency is the right call while the founder still runs most of the company. Once the business starts copying itself into new locations or markets, it needs a system that sets goals, tests hypotheses and owns the result.

Why healthcare marketing agencies stall: the short, mid and long wins model we use with clinics
Most agencies own the click and nobody owns the front desk. How we structure clinic work in three horizons, the research behind each one, and one year of results.

Why channel tests stall after month three
Most paid channel tests do not end with a decision. They end when the budget runs out, the attribution model changes, or everyone quietly stops looking at the dashboard.