SaaS metrics (MRR, ARR, burn multiple)
SaaS metrics are the small set of numbers that show how big a subscription business is, how much of it stays, and how much cash each new dollar of recurring revenue costs.
SaaS metrics are the handful of numbers that show whether a subscription business grows efficiently: MRR and ARR for the size of recurring revenue, retention for how much of it stays, CAC payback and LTV to CAC for acquisition cost, and burn multiple for how much cash each new dollar of ARR consumes. Together they say whether growth is healthy.
- Origin
- David Skok (SaaS metrics practice); David Sacks (burn multiple, Craft Ventures), burn multiple published 23 April 2020; the other metrics have no single date
- Level
- 301 · Advanced
- Fits
- Startup, Scale-up
- Time to apply
- One afternoon to build the first monthly scorecard
- What you need
- a billing export with customer, plan, price and billing interval for every active subscription · monthly cash in and cash out, so net burn can be read from the bank rather than estimated · one written rule for what counts as recurring (setup fees, usage and services)
SaaS metrics are the numbers a subscription business uses to describe its health: how much revenue repeats, how much of it stays, what it costs to win a customer and how much cash growth burns. The set grew out of software-as-a-service investing, where revenue arrives in small monthly pieces and the acquisition bill arrives upfront. David Skok’s SaaS Metrics 2.0 is the best-known operator essay, and David Sacks added burn multiple in 2020. No single body owns the definitions, which is why the first job is to write them down.
MRR and ARR: the revenue that repeats
MRR (monthly recurring revenue) is the normalised, predictable revenue a subscription business expects each month from active customers, and ARR (annual recurring revenue) is that figure annualised. ChartMogul breaks MRR movement into new business, expansion, contraction, churn and reactivation, and says to multiply MRR by 12 for ARR. Skok’s essay uses a shorter split of new, expansion and churn, and sums them as net MRR bookings.
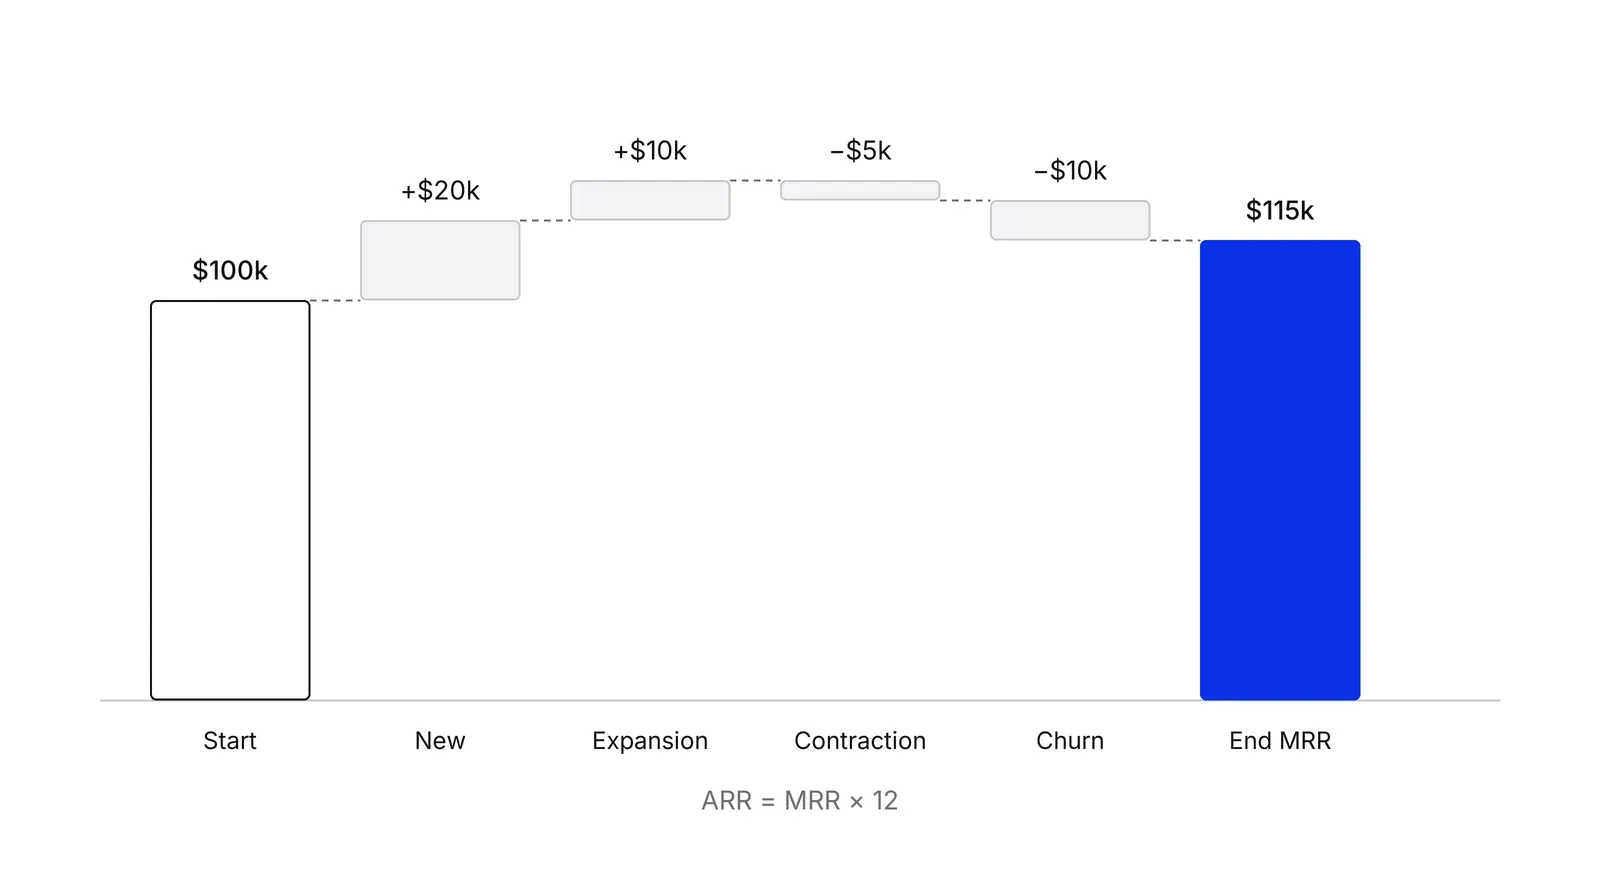
Take an illustrative company, using the ChartMogul movements above, that starts a quarter with $100k of MRR. It adds $20k from new customers and $10k from expansion, then loses $5k to contraction and $10k to churn. Ending MRR is $115k, so ARR is $1.38M and net new MRR is $15k. Both numbers exclude one-off fees: Andreessen Horowitz warns that multiplying a month’s total bookings by 12 often overstates ARR, and Bessemer says ARR nets out non-recurring revenue.
ARR has no single definition. In a 2019 reply to the SEC, Varonis described it as the annualised value of all active contracts at period end. In a 2025 reply, i3 Verticals described it as a quarter’s recurring revenue multiplied by four, including transaction-based and payments revenue. Both are defensible, and they give different numbers for the same company. SEC staff asked i3 to explain the calculation under Release 33-10751, which expects a clear definition, why the metric is useful and how management uses it.
Burn multiple: what each new dollar of ARR costs
Burn multiple is net burn divided by net new ARR for the same period. David Sacks wrote it up for Craft Ventures on 23 April 2020, as the downturn deepened. He built it as an inverted version of Bessemer’s efficiency score, which he gives as net new ARR over net burn. Bessemer’s later scaling guide uses “efficiency score” for a different formula, free cash flow margin plus growth rate, so check which one a source means.
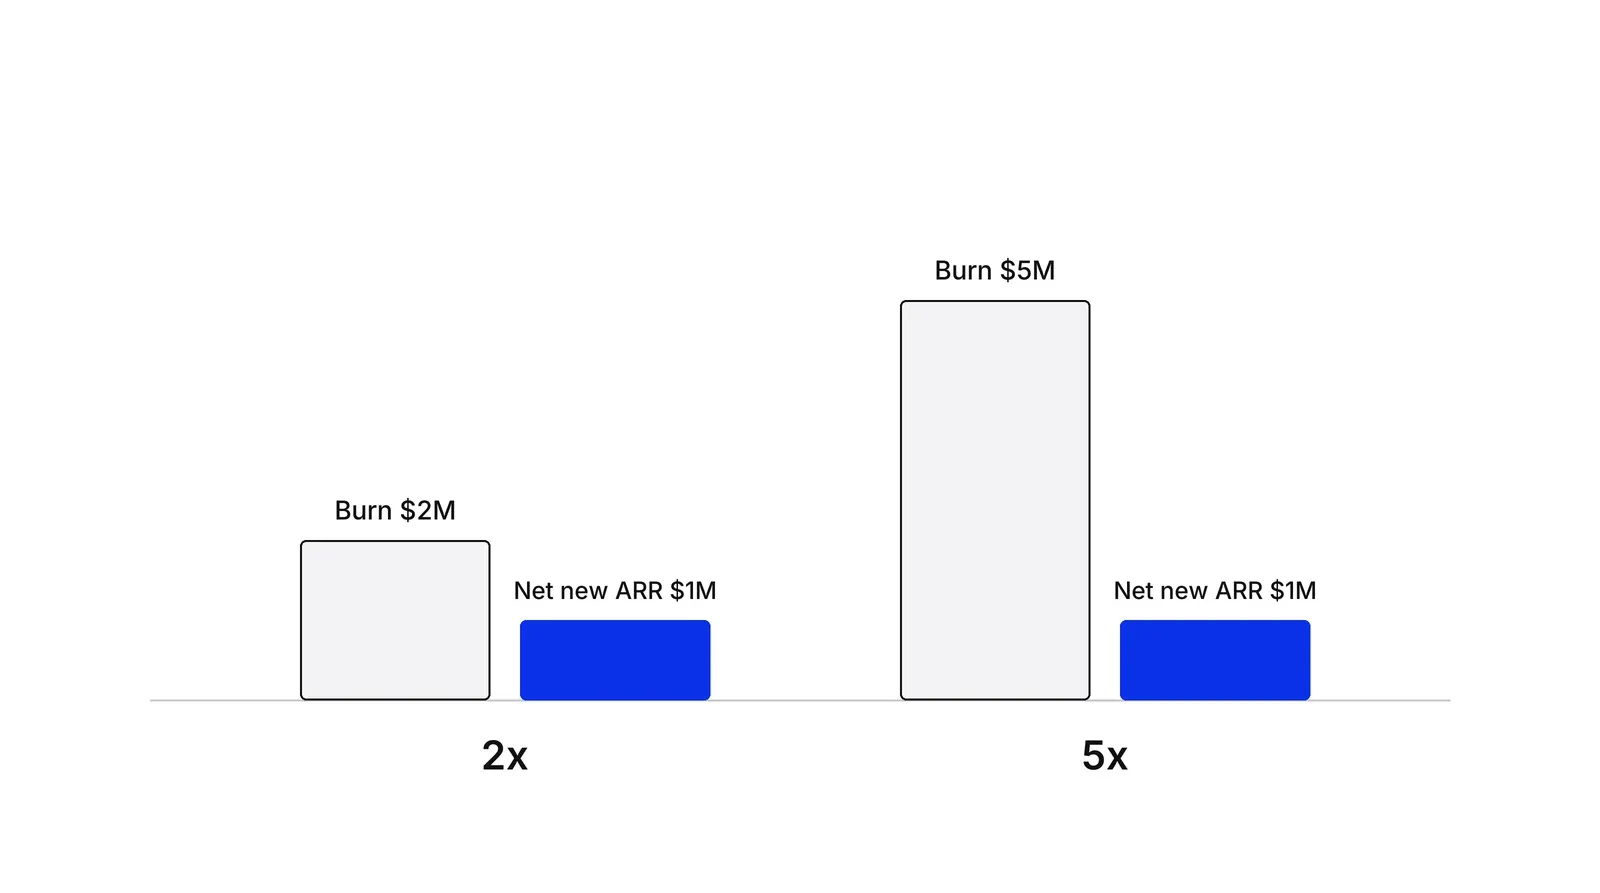
The post gives its own benchmarks in text. In Sacks’s example, burning $2M to add $1M of ARR is a 2x multiple, which he calls reasonable early on. Burning $5M for the same ARR is a terrible 5x. A required burn of 3x or more suggests that product-market fit is weaker than it looks. Sacks expects the number to fall with age: about 3 at seed, about 2 after a Series A, and lower after a Series B. A five-band scale from “amazing” to “bad” circulates on secondary sites, but we could not find it in the text of the post, so we do not use it.
Why it works as a catch-all: any serious problem raises burn, lowers net new ARR, or both. Sacks lists gross margin trouble, sales inefficiency and churn, because churn nets against the denominator. It also forgives the past. Cutting costs improves the multiple in the next period, unlike a ratio built on total capital raised.
The rest of the scorecard
Each question about a subscription business has a deeper page. Use this table to find it.
| Question | Metric | Read more |
|---|---|---|
| Does the base keep and grow its spend? | Net revenue retention | Net revenue retention |
| How fast does a customer repay acquisition cost? | CAC payback | CAC payback period |
| Does lifetime value justify the cost? | LTV to CAC | LTV to CAC ratio |
| Is sales and marketing spend producing revenue? | Magic number | Magic number (related page) |
| Do growth and profit add up to enough? | Rule of 40 | Rule of 40 (related page) |
| Does one customer or order pay for itself? | Unit economics | Unit economics |
| What contract design drives all of this? | Subscription model | Subscription model |
The magic number comes from Scale Venture Partners, where Rory O’Driscoll named it after seeing more than $2 of first-year revenue per $1 of go-to-market spend, per Scale’s account. The Rule of 40 is older folklore: Brad Feld heard it from an unnamed late-stage investor and refined it in 2015.
Typical values, with their sources
Treat benchmarks as statements about one dataset. SaaS Capital’s 14th survey of more than 1,000 private B2B companies reported median net retention of 101% and median growth of 24%, and its 15th survey puts median growth at 22%. Benchmarkit reports 101% net retention and 26% growth for 2024 data. The Aleph and Benchmarkit 2026 report covers 342 companies and finds a median magic number of 1.37 and CAC payback of 16 months. None of these sources reports a median burn multiple, so use Sacks’s examples as a guide, not a league table.
Read them together
One metric rarely settles anything. Skok puts retention first, because acquiring customers does not help if they leave. Gupta, Lehmann and Stuart estimate that a 1% retention gain lifts customer value by 3 to 7%. Tomasz Tunguz shows how the gap compounds: each extra 20 points of net dollar retention roughly doubles ARR over five years. On payback, Kellblog points out that a month-to-month customer and a prepaid multi-year customer can have very different cash exposure at similar payback.
When the multiple rises, trace it. A worse burn multiple with flat retention points to acquisition cost. A worse one with falling retention points to a leaky bucket. A Growth Lab plan starts from this scorecard, so each growth bet is judged on retention, payback and burn together; see the Growth Lab practice.
How to apply SaaS metrics (MRR, ARR, burn multiple), step by step
- Write the definition of recurring. List every revenue line and mark it recurring, variable or one-off. Setup, consulting and hardware fees are one-off. Result: a one-page rule that every later number uses.
- Build the MRR bridge. Start with last month's MRR. Add new, add expansion, subtract contraction and subtract churn, then compare the result with this month's MRR. Result: a bridge that ties out to the dollar.
- Annualise with a stated method. Multiply month-end MRR by 12 to get ARR, or follow the contract-value method your investors expect. Write the method beside the number. Result: an ARR figure someone else can reproduce.
- Read net burn from cash. Take cash spent minus cash received in the period. Do not use accounting profit. Result: a net burn figure for the same quarter as the ARR bridge.
- Divide burn by net new ARR. Net new ARR is new plus expansion minus contraction and churn, annualised. Divide net burn by it. Result: a burn multiple you can track quarter by quarter.
- Attach the deeper metrics. Add retention, CAC payback and LTV to CAC from the linked pages, each on the same period and the same definition of a customer. Result: one scorecard where growth, retention, acquisition cost and cash agree or disagree.
Examples
A telehealth membership (illustrative)
Members pay a flat monthly fee, so MRR is active members times the fee and ARR is that figure times twelve. Each member also pays a one-off intake fee. The fee is revenue but not MRR, and leaving it out keeps ARR honest.
A payments platform billing merchants (illustrative)
Each merchant pays a $300 monthly platform fee plus a per-transaction fee that moves with volume. The team counts only the fixed fee in MRR and tracks transaction revenue on its own line, because volume can fall without a single cancellation.
Sacks's quarterly board example
David Sacks describes a startup whose quarterly burn is double its added ARR: a 2x burn multiple, which he calls reasonable early on. If burn were five times added ARR, the multiple would be 5x and he says the company should probably cut costs.
When to use it
Use them when revenue repeats on a contract or plan and you need one shared language for the board, investors and the team. They suit the stage where cash is a constraint and growth spending needs a test.
When not to use it
Skip the full set before the first paying customers: pre-revenue companies have zero net new ARR, so burn multiple cannot be computed. Do not apply them to one-off sales or heavy services revenue, where recurring revenue is a minor share of the business.
Common mistakes
- Multiplying one month of total bookings by 12 and calling it ARR. That sweeps in setup, hardware and consulting fees.
- Changing the ARR or MRR method between quarters without telling anyone, so a trend that is partly a definition change reads as performance.
- Computing burn multiple from accounting loss instead of cash, or from gross burn instead of net burn.
- Comparing your numbers with a benchmark built on a different definition, sample or year.
- Watching growth alone. A fast ARR line with falling retention and a rising burn multiple is a leaky bucket.
FAQ
What is the difference between MRR and ARR?
MRR is the normalised recurring revenue a business expects each month from active customers. ARR is that figure annualised, usually MRR times 12. ChartMogul and Bessemer both exclude one-off fees. Monthly-billed products tend to report MRR, and annual-contract products tend to report ARR.
How do you calculate burn multiple?
Divide net burn by net new ARR for the same period. David Sacks defined it as net burn over net new ARR. A company whose burn is double its added ARR has a burn multiple of 2x. Lower means more efficient growth.
What is a good burn multiple?
Sacks wrote that 2x is reasonable for an early-stage startup, 3x or more suggests a product-market fit or other problem, and 5x is terrible. He expects the number to fall as the company matures. Pre-revenue companies cannot compute it.
Is ARR the same as revenue?
No. Revenue is recognised under accounting rules as service is delivered. ARR is an operating metric that annualises recurring contracts or revenue. SEC staff have questioned whether the label fits when ARR is not actual revenue, and some companies now say annualised recurring revenue.
Which SaaS metric should a founder watch first?
Start with retention. David Skok argues that acquiring customers does not help if they leave, and treats net revenue churn above 2% per month as a serious problem. After that, check how fast acquisition spend returns, then the burn multiple.
Sources
- David Sacks, Craft Ventures, The Burn Multiple (2020)
- Bessemer Venture Partners, scaling guide for cloud companies
- David Skok, For Entrepreneurs, SaaS Metrics 2.0
- Brad Feld, The Rule of 40% for a healthy SaaS company (2015)
- ChartMogul, Monthly recurring revenue (MRR)
- ChartMogul help, Net MRR retention
- Andreessen Horowitz, 16 startup metrics
- Kellblog (Dave Kellogg), The CAC ratio
- Kellblog (Dave Kellogg), The ultimate SaaS metric: LTV/CAC
- SEC, Varonis Systems correspondence on ARR (2019)
- SEC, i3 Verticals correspondence on ARR (March 2025)
- SEC, Release 33-10751, Commission Guidance on MD&A key performance indicators (2020)
- SaaS Capital, B2B SaaS retention benchmarks, Research Brief 32 (2025)
- SaaS Capital, 2026 private B2B SaaS company growth rate benchmarks
- Benchmarkit, 2025 SaaS Performance Metrics
- Aleph, CAC payback period for SaaS (Aleph and Benchmarkit report, 2026)
- Scale Venture Partners, A history of the magic number
- Ray Rike, SaaS Barometer, Customer acquisition cost payback period (2024)
- Tomasz Tunguz, The NDR delta
- Gupta, Lehmann and Stuart, Valuing Customers, Journal of Marketing Research (2004)
- Bill Gurley, Above the Crowd, The dangerous seduction of the LTV formula (2012)
Last updated Oct 9, 2026


Marketing agency or growth system: when a company outgrows its agency
An agency is the right call while the founder still runs most of the company. Once the business starts copying itself into new locations or markets, it needs a system that sets goals, tests hypotheses and owns the result.

Why healthcare marketing agencies stall: the short, mid and long wins model we use with clinics
Most agencies own the click and nobody owns the front desk. How we structure clinic work in three horizons, the research behind each one, and one year of results.

How to calculate channel payback and unit economics
A CAC number that only marketing believes will not survive a finance review. This guide calculates channel payback so both teams work from the same model.