Lead scoring
Lead scoring gives every lead a number that ranks who sales should contact first, built either from hand-set rules for fit and behaviour or from a model trained on past wins.
Lead scoring is a method of ranking potential customers by their likelihood to buy, so sales contacts the best ones first. A rules-based score adds points for who the lead is (fit) and what they did (behaviour). A predictive score is learned from past wins. Either one must be checked against closed-won deals.
- Origin
- No single originator; developed in practice and built into CRM and marketing automation tools, no documented first use
- Level
- 201 · Tool
- Fits
- Small and mid-size, Scale-up
- Time to apply
- one working session for a first model; one quarter of closed deals to judge it
- What you need
- a CRM export of past leads with the final outcome (won, lost, still open) and the date each lead was created · a list of behaviours you can track, such as demo requests, pricing-page visits and email replies · one person from sales who will say which leads they would call first
Lead scoring is a method of ranking potential customers by their likelihood to make a purchase, so that sales contacts the most promising ones first. The number comes from points set by hand or from a model trained on past results, and it feeds the handoff between MQL and SQL.
Rules-based scoring: fit plus behaviour
Rules-based scoring adds points for traits and actions that you choose. Vendors describe two parts. Bitrix24 splits them into fit, meaning who the lead is, and engagement, meaning what they did. Adobe’s Marketo documentation keeps a demographic score for fit and a behaviour score for intent, and HubSpot offers fit, engagement and combined scores.
Keep the two parts separate. High fit with no activity needs nurturing. Heavy activity with poor fit may be a student or a competitor. One blended number hides which case you have.
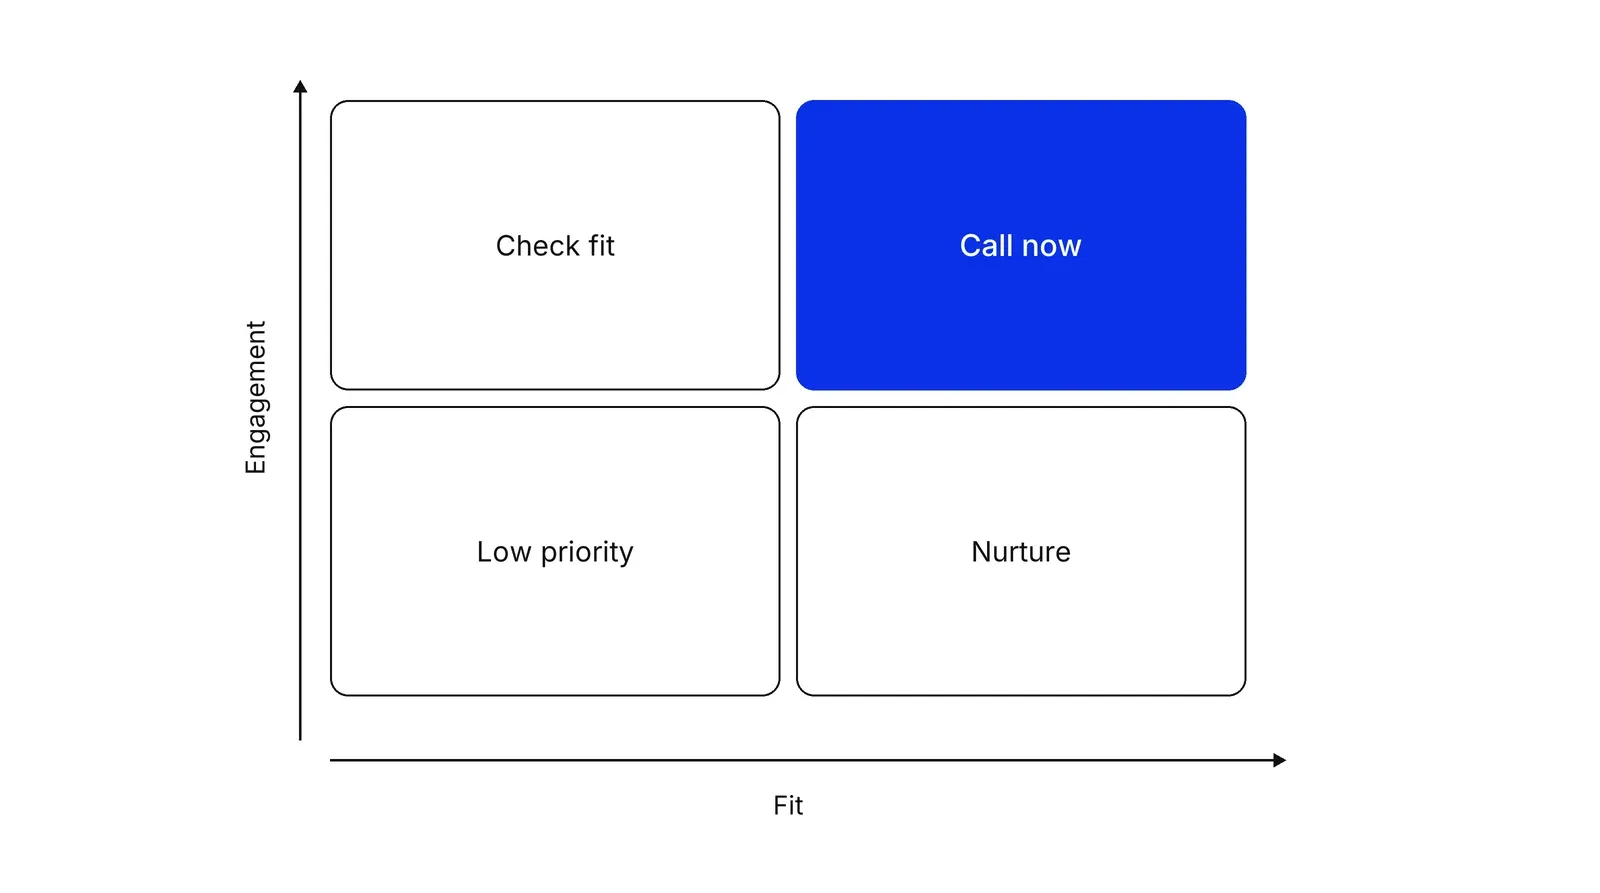
Fit is the easier half to write down. Salesforce lists geography, role, company size and industry as common criteria, and an ideal customer profile gives you the first draft. Budget, authority, need and timeline from BANT are often better as questions a rep asks than as fields to score.
| Choice | What vendors document |
|---|---|
| Negative points | Salesforce says to include negative scoring to disqualify leads, for example a careers-page visit. Adobe’s examples take 10 points off for no interaction in 90 days or for a very small company. |
| Once or every time | Adobe says to decide per signal whether it scores once or repeatedly. HubSpot lets you cap the points one repeated event can add, with a default maximum of 100 points per score and a custom range of up to -10,000 to 10,000. |
| Threshold | Adobe says to set the handoff number high enough that several interactions are needed, based on how many touchpoints won deals needed. It suggests starting near 100, though its own worked example uses 50. |
Where do the point values come from? Often from guesses. A Forrester analyst writes that points and thresholds are typically based on guesses and random estimates. So validation matters more than the point table.
Score decay: why old points should fade
Score decay reduces the points a lead holds as the action ages or as the lead goes quiet. Without it, scores only rise and the top of the list fills with people who were active long ago.
The vendors implement it differently. HubSpot lets you reduce an event’s points every 1, 3, 6 or 12 months, counting each month as 30 days and calculating from the original points. Salesforce’s Account Engagement training describes decay as reducing a score for inactivity and resets scores to zero by an automation rule, while its Einstein behaviour scoring has decay built in. Adobe’s guide covers a negative trigger for inactivity but no gradual decay.
Match the decay speed to your sales cycle: a demo request from three months ago says little when deals close in two weeks. Speed matters here too, since a 2011 Harvard Business Review study found that most companies are not responding nearly fast enough to online inquiries.
Predictive scoring: learning from past wins
A predictive score is a probability produced by a model trained on historical leads and their outcomes. HubSpot’s version estimates the chance that an open contact becomes a customer within 90 days, splits contacts into four equal priority tiers, and is available only in Enterprise plans. HubSpot calls it black-box machine learning: you see inputs and outputs, not how each input moves the score. Salesforce’s Einstein Lead Scoring analyses historical lead fields to rate how closely current leads match past conversions. Its sibling, Einstein Behavior Scoring in Account Engagement, gives prospects a score from 0 to 100 and works best with about a year of engagement data and at least 20 prospects linked to opportunities.
Duncan and Elkan argued at KDD in 2015 that hand-tuned scoring is error-prone and built models that correct selection bias from the old system’s choices. Nygård and Mezei found that supervised learning, with random forest as an example, can estimate purchase probability, and they limited past buyers’ data to the period before purchase. A 2025 Frontiers in Artificial Intelligence case study took 23,154 Microsoft Dynamics records with 67 fields, cleaned them to 16,600 records with 22 fields, and compared 15 algorithms on a 70/30 train-test split. Gradient Boosting reported 0.9839 accuracy, while its authors note the target is highly imbalanced, which can make accuracy misleading, and that one SME limits generalisation. Its most influential features included lead source and a reason-for-status field, which a rep fills in after working the lead. That is the leakage risk described below.
| Rules-based | Predictive | |
|---|---|---|
| Who sets weights | A person | The model, from history |
| Data needed | Little; judgement and a few past wins | Enough past leads with outcomes |
| Typical weakness | Guessed points | Learns old habits and biased data |
A common path: start with rules, collect clean outcomes, then test a model against the rules on newer leads. D’Haen and Van den Poel’s Ghent University three-phase framework follows that order, beginning with only current customers’ data, and Wu, Andreev and Benyoucef of the University of Ottawa add purchase intention in 2024.
Validating against closed-won
Validation means scoring past leads as they looked on arrival and checking whether high scores won more. Without it, a score is an opinion.
Take an illustrative quarter: 2,000 leads and 100 closed-won deals, a 5% overall win rate. The top 20% by score (400 leads) holds 60 wins, a 15% win rate. The middle 40% (800 leads) holds 30 wins, 3.75%. The bottom 40% (800 leads) holds 10 wins, 1.25%. The high band wins 12 times as often as the bottom one. The numbers are arithmetic, not a benchmark.
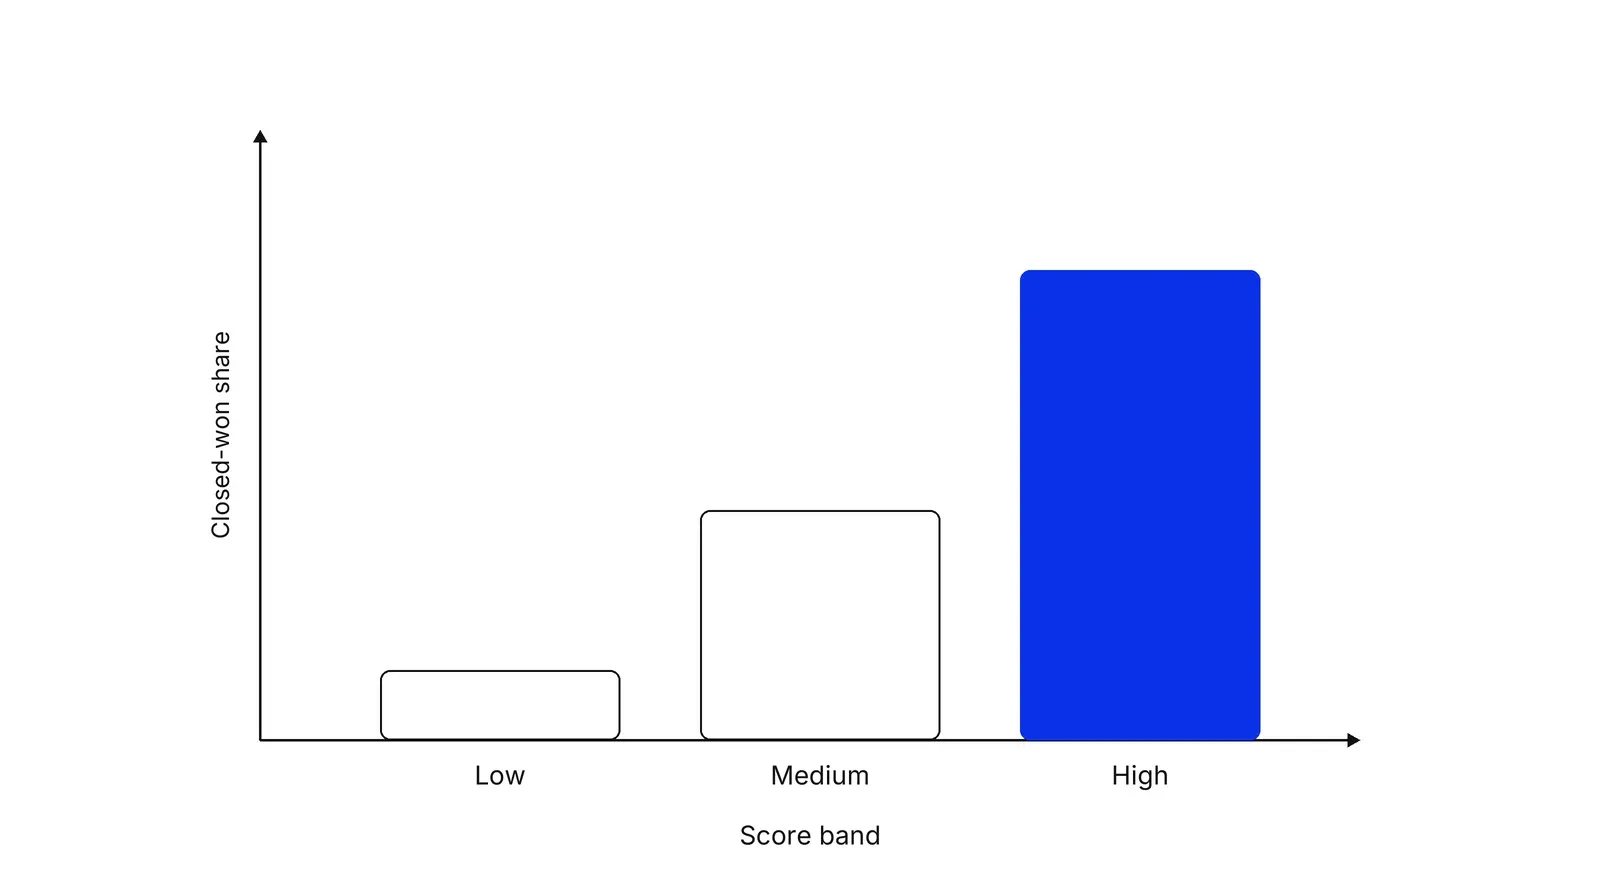
Four rules keep the test honest.
- Test on later leads than you built on. scikit-learn’s time-ordered splitter exists because ordinary splits train on future data and evaluate on past data.
- Block leakage. Leakage is using information that would not be available at prediction time, such as a status set after sales contact. In scikit-learn’s demonstration, picking features on all 200 samples before splitting gave 0.76 accuracy on random data, where chance is 0.5.
- Compare with a baseline. For average precision, a random ranking scores the fraction of positive samples, so with 5% winners a model must beat 5%, not 50%.
- Check calibration if you quote probabilities. A calibrated score of 0.8 means that about 80% of such leads are positive.
Selection bias is the hidden trap. Reps only worked the leads the old score ranked high, so those outcomes dominate the data, which Duncan and Elkan’s models were built to address. A 2013 Journal of Marketing study of 461 reps at four firms found that lead prequalification and managerial tracking shape how much attention reps give marketing leads. A score nobody follows cannot be validated.
Once the bands separate, name them. HubSpot’s own example, a company called Sprocket, used High (70 to 100), Medium (40 to 69) and Low (0 to 39) and routed the high group to reps by workflow.
Where scoring breaks down
Person-level scores miss committees. Forrester reports that 28% of B2B buyers decided in groups of four to nine and 46% in groups of two to three, and argues that scoring a buying group beats scoring individual leads. If your deals involve several people, roll scores up to the account. The same idea, scoring behaviour to predict an outcome, applies after the sale in a customer health score and predictive churn modeling. A Growth Lab plan starts from the outcome you want the score to predict.
How to apply Lead scoring, step by step
- Fix the outcome you want to predict. Pick one result, such as a closed-won deal within 90 days of the lead being created. Write it down with the CRM field that proves it. Result: one yes-or-no outcome that the whole score is judged against.
- Pull the past leads and mark winners. Export the last 6 to 12 months of leads with creation date, source, company details, activity and the outcome. Result: a table where every row is a lead and one column says won or not won.
- Split the score into fit and engagement. List the traits that match your ideal customer profile for fit, and the actions that show intent for engagement. Give each a point value that reflects how often it showed up in wins. Add negative points for signals such as a careers-page visit. Result: two short scorecards, one for fit and one for engagement.
- Set the decay and the cap. Decide how fast engagement points age, and cap how many points one repeated action can add. Result: a rule such as 'points fall after 30 days, and one action counts at most twice'.
- Check the score against closed-won. Score the old leads as they would have scored on the day they arrived. Group them into high, medium and low bands and count the share won in each. Result: a band table that shows whether high-scoring leads win more often.
- Attach an action to each band. Decide what happens at each band: call within the hour, a nurture sequence, or no action. Name the owner. Result: a score that changes what people do on Monday.
- Review on a schedule. Repeat the band check every quarter with fresh deals and change point values or thresholds only when the data supports it. Result: a score that follows the market.
Examples
A payments platform selling to online merchants
Illustrative: a payments company scores fit on monthly card volume, country and business type, and scores engagement on a pricing-page visit, a sandbox sign-up and a reply to a sales email. A merchant below the minimum volume gets negative fit points however often they visit. A high-volume merchant with a sandbox sign-up this week lands in the call-now group. A high-volume merchant who went quiet for 90 days drops into nurture as the engagement points decay.
A private dental group booking implant consultations
Illustrative: a clinic group scores web enquiries on distance from the clinic, the treatment requested and whether the person booked a slot or only read a page. An enquiry for implants within 20 km that came with a phone number is called first. A student downloading a price list from another city is not. Names and health details stay out of the scoring fields; only the treatment category and booking action are used.
A 12-person software company with 30 leads a month
Illustrative: with so few leads, a model cannot learn anything. The founder writes five fit rules and three behaviour rules on one page, scores by hand each Friday, and checks each quarter which leads won.
When to use it
Use lead scoring when more leads arrive than sales can call, quality varies widely, and the CRM holds a few months of recorded outcomes.
When not to use it
Skip it when one person can read every lead, when you sell to a short list of named accounts, or when committees decide. Score accounts or buying groups there.
Common mistakes
- Setting point values by feel and never testing them. Forrester's analysts say points and thresholds are typically based on guesses.
- Letting engagement points pile up with no decay, so a contact who clicked ten emails last year outranks a buyer who asked for a quote yesterday.
- Mixing fit and behaviour into one number, so nobody can tell whether a lead scored high because of who they are or because of what they clicked.
- Training or testing a model with information that only exists after sales has worked the lead, such as lead status fields, which makes the score look better than it is.
- Judging the score only on leads that sales chose to call, which hides the good leads the old rules never sent.
FAQ
What is lead scoring?
Lead scoring is a method of ranking potential customers by their likelihood to buy. It combines what a prospect does, such as opening emails or viewing a pricing page, with traits such as company size or industry, so sales contacts the highest-scoring leads first.
What is the difference between rules-based and predictive lead scoring?
In rules-based scoring, people choose the traits and point values. In predictive scoring, a model learns from past leads which traits go with winning and outputs a probability. Rules are easy to explain. Predictive scoring needs enough history and can be a black box.
What is score decay?
Score decay reduces the points a lead earned as the action gets older, or for inactivity. HubSpot lets you reduce an event's points every 1, 3, 6 or 12 months. Decay keeps a lead who was active last year from outranking one who is active now.
How do you know if your lead score works?
Score past leads as they looked when they arrived, group them into bands, and compare the closed-won share in each band. A working score shows the high band winning clearly more often than the low band. Test on newer leads than the ones used to build it.
How many leads do you need for predictive lead scoring?
There is no universal minimum. Published studies use thousands of CRM records, and vendors set their own limits and tell you in the product. With a few hundred leads and few wins, a model has little to learn from, and a hand-built scorecard is safer.
Sources
- Bitrix24, What is lead scoring? (vendor glossary)
- Bitrix24, Turn scores into daily sales execution (vendor documentation)
- HubSpot Knowledge Base, Set up score properties to qualify leads (vendor documentation)
- HubSpot Knowledge Base, Build lead scores to qualify contacts, companies, and deals (vendor documentation)
- HubSpot Knowledge Base, Determine likelihood to close with predictive lead scoring (vendor documentation)
- Salesforce Trailhead, Get started with lead scoring (vendor training)
- Salesforce Trailhead, Einstein scoring in Account Engagement (vendor training)
- Salesforce, Sales Qualified Leads: What They Are and How to Qualify Them (vendor blog)
- Adobe Experience League, Build Person Scoring Models for Marketo Engage Programs (vendor documentation)
- Forrester, The Revenue Process Alignment Series, Part 1: The End of MQLs, 2022
- Forrester, Saying Goodbye To MQLs: A Parting That Is All Sweet And No Sorrow, 2023
- James Oldroyd, Kristina McElheran, David Elkington, The Short Life of Online Sales Leads, Harvard Business Review, 2011
- Gaurav Sabnis, Sharmila Chatterjee, Rajdeep Grewal, Gary Lilien, The Sales Lead Black Hole, Journal of Marketing, 2013
- Robert Nygård, József Mezei, Automating Lead Scoring with Machine Learning: An Experimental Study, HICSS, 2020
- Brendan Duncan, Charles Elkan, Probabilistic Modeling of a Sales Funnel to Prioritize Leads, KDD, 2015 (bibliographic record and abstract)
- J. D'Haen, Dirk Van den Poel, Model-supported business-to-business prospect prediction based on an iterative customer acquisition framework, Ghent University working paper, 2013
- Migao Wu, Pavel Andreev, Morad Benyoucef, Smart Sales: Amplifying the Power of Predictive Lead Scoring in B2B Sales, PACIS, 2024
- Frontiers in Artificial Intelligence, The relevance of lead prioritization: a B2B lead scoring model based on machine learning, 2025
- scikit-learn documentation, TimeSeriesSplit
- scikit-learn documentation, Common pitfalls and recommended practices (data leakage)
- scikit-learn documentation, Probability calibration
- scikit-learn documentation, Metrics and scoring: quantifying the quality of predictions
Last updated Oct 9, 2026


Marketing agency or growth system: when a company outgrows its agency
An agency is the right call while the founder still runs most of the company. Once the business starts copying itself into new locations or markets, it needs a system that sets goals, tests hypotheses and owns the result.

Why healthcare marketing agencies stall: the short, mid and long wins model we use with clinics
Most agencies own the click and nobody owns the front desk. How we structure clinic work in three horizons, the research behind each one, and one year of results.

Why channel tests stall after month three
Most paid channel tests do not end with a decision. They end when the budget runs out, the attribution model changes, or everyone quietly stops looking at the dashboard.