Empathy map
An empathy map is a one-page canvas on which a team records what one person or customer type sees, hears, says and does, and then infers what they think and feel, so everyone works from the same picture of that person.
An empathy map is a one-page canvas that captures what a specific person or customer type sees, hears, says and does, and what they probably think and feel. Teams build it from interview notes and observation to share one picture of the customer before designing a product, message or service. Dave Gray's 2017 version adds a goal at the top and fills the sections in a fixed order.
- Origin
- Scott Matthews and Dave Gray at XPLANE; published in Gamestorming by Dave Gray, Sunni Brown and James Macanufo, mid-2000s; in print 2010; canvas updated 2017
- Level
- 201 · Tool
- Fits
- Startup, Small and mid-size
- Time to apply
- 20 minutes for a rough map from what you already know; 60 to 90 minutes for a team session built on research
- What you need
- one person or customer type to map, and one question about them · notes from interviews, support tickets, reviews or observation · 2 to 6 people, a wall or whiteboard, sticky notes
An empathy map is a one-page canvas on which a team writes down what one person, or one type of customer, sees, hears, says and does, and then works out what that person probably thinks and feels. Nielsen Norman Group calls it “a collaborative visualization” of what a team knows about a user. It takes 20 minutes to sketch and an hour or two to do well, and product teams, marketers, service designers and medical educators all use it.
Where the empathy map came from
The empathy map was born at XPLANE, a visual thinking consultancy. According to XPLANE’s own history, creative director Scott Matthews drew caricature “big heads” in the mid-2000s to capture what the team knew about the people a project was for. Founder Dave Gray turned the sketches into a structured exercise. It reached print in 2010 in Gamestorming, a book of workshop games by Gray, Sunni Brown and James Macanufo, and the Gamestorming site notes that Alex Osterwalder featured it in Business Model Generation the same year.
No source gives an exact year for the first map. XPLANE says mid-2000s; Gray himself wrote that “we designed the Empathy Map at XPLANE many years ago.”
From there it spread fast. Stanford’s d.school taught a version, and Tom and David Kelley of IDEO named it one of three creativity challenges in Harvard Business Review in 2012. Public bodies use it too, from the NSW Government’s design system to NHS Education for Scotland, which offers it for quality improvement work with patients and staff.
Two versions: four quadrants and the 2017 canvas
The version most people meet online is a square split into four quadrants: says, does, thinks and feels, with the user in the middle. IDEO and NN/g both teach this form. Gray grew unhappy with how far copies had drifted. In a July 2017 post he wrote that the versions spreading across the web had “somewhat degraded the original concept,” and he published an updated canvas, drawing on what he had learned about canvas design while building the Culture Map with Osterwalder.
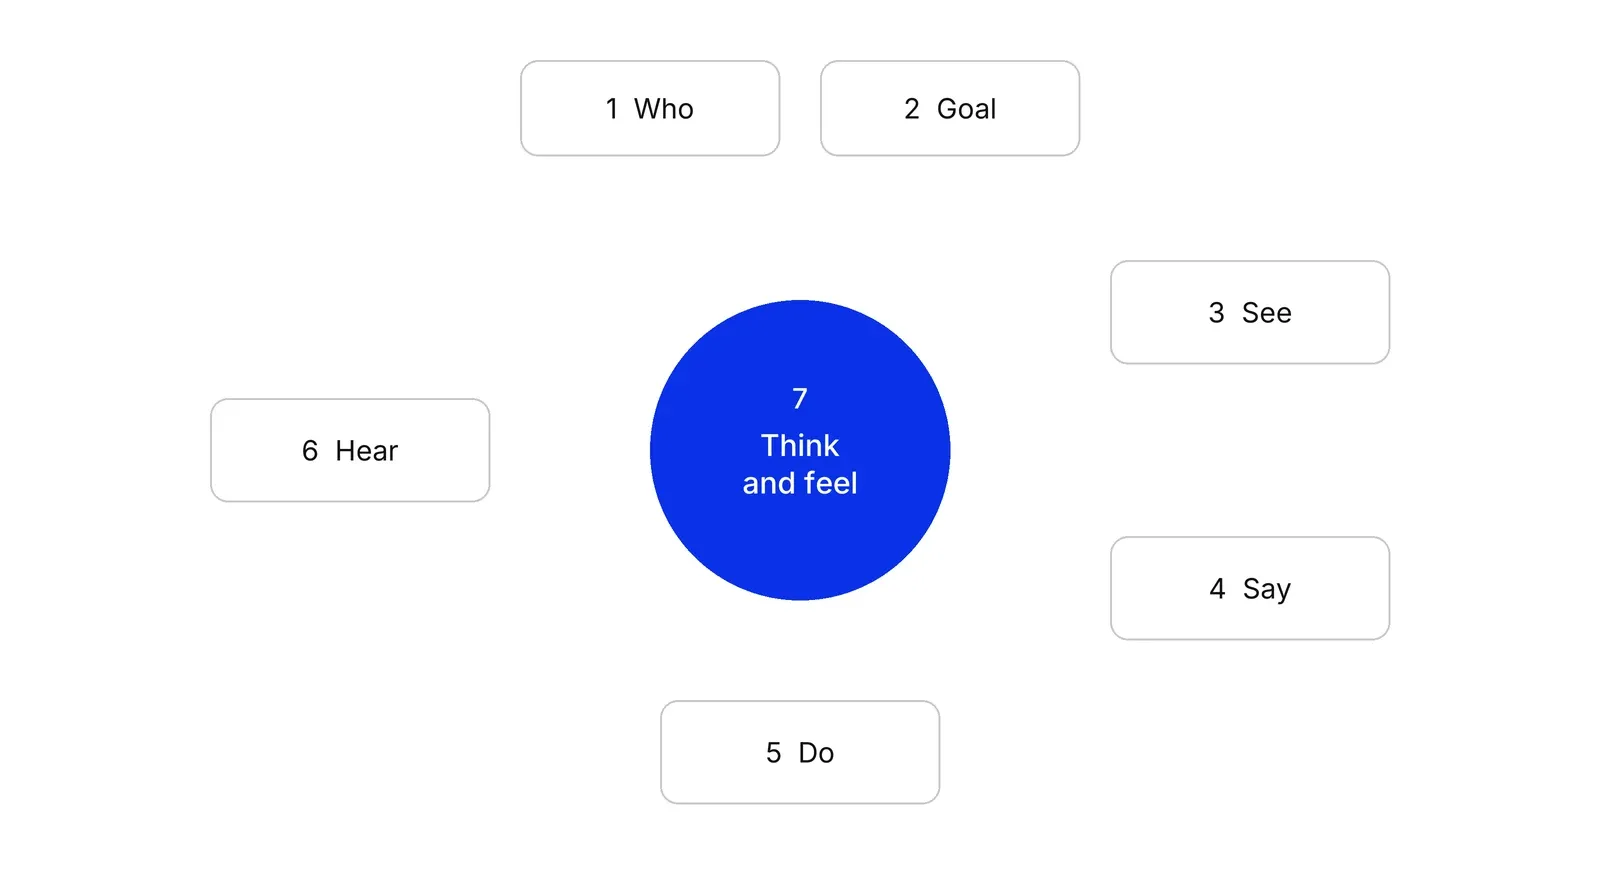
| Four-quadrant map | Gray’s 2017 canvas | |
|---|---|---|
| Sections | Says, does, thinks, feels | Who, goal, see, say, do, hear, think and feel (pains and gains) |
| Order | Any; IDEO suggests says and does first | Numbered 1 to 7 |
| Goal | Not on the map | What the person needs to do, and how you know they succeeded |
| Main use | Sorting interview notes | Aligning a team on one person and one outcome |
The 2017 changes were small but deliberate. Gray added the goal, usually the output of a separate exercise XPLANE calls WHO/DO. He numbered the sections. He moved think and feel into the head at the centre, with pains and gains inside it. He also added starter questions to each box.
The questions on the 2017 canvas
The canvas PDF, dated 16 July 2017, gives each section its own prompts:
- Who are we empathizing with? Their situation and their role in it.
- Goal. What do they need to do, or do differently? Which jobs and decisions are in front of them? How will we know they succeeded?
- See. What do they see in the marketplace, in their immediate environment, and others saying and doing? What are they watching and reading?
- Say. What have we heard them say? What can we imagine them saying?
- Do. What do they do today? What behaviour have we observed?
- Hear. What do they hear from friends, from colleagues, second-hand?
- Think and feel. Pains: fears, frustrations and anxieties. Gains: wants, needs, hopes and dreams.
Gray first framed the goal as a behaviour the team wanted the person to adopt. Some readers found that wording “manipulative,” at odds with the point of empathizing, so he softened it to allow a broader inquiry. If you map customers to sell to them, keep that criticism in mind.
Why the head sits in the middle
The canvas separates what you can observe from what you can only infer. Seeing, hearing, saying and doing happen outside the head, and a researcher can witness them or hear about them. Thoughts and feelings happen inside, where Gray says they “can be guessed or inferred but never observed.” That is why the canvas sends you clockwise around the outside first and into the head last. Gray compares the circuit to walking a mile in the person’s shoes. The exercise was originally called “The Big Head.”
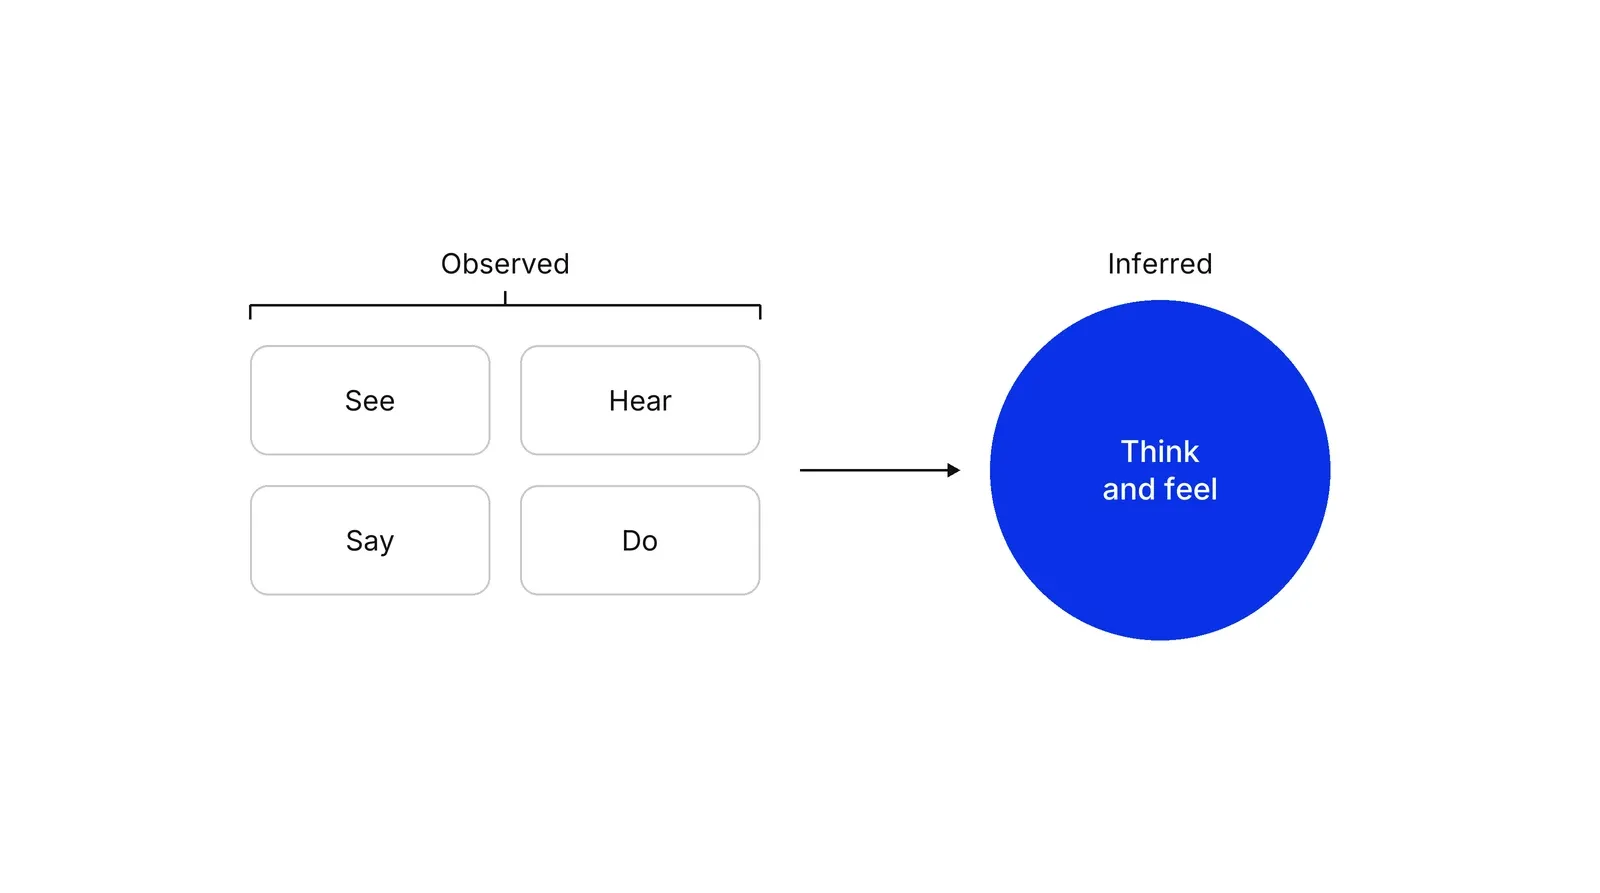
The four-quadrant version makes the same split. The Center for Care Innovations, which works with safety-net health clinics, describes say and do as “very explicit” and think and feel as implicit. The useful findings often sit where the two disagree. Stanford’s d.school process guide says some of the most powerful realizations come from “a disconnect between what someone says and what he does.” A merchant who says fees are the problem but leaves at the document upload step is telling you two different things.
One person or a whole segment
NN/g distinguishes two kinds of map. A one-user map records a single interview or observation. An aggregated map combines several one-user maps from the same segment, and NN/g treats it as a first step toward a persona that does not replace one. Keep each map to one role in one situation; a map of “all our customers” fills with contradictions. Our buyer persona page covers the persona itself.
XPLANE usually builds two or three maps per project, one for each key role, and backs them with interviews. The Atlassian Team Playbook suggests one to three personas, three to six people and an hour of mapping.
Empathy map, journey map or persona?
They answer different questions, and NN/g’s mapping cheat sheet sets out the difference.
| Tool | What it describes | Time | Best moment |
|---|---|---|---|
| Empathy map | The mindset of one user type | No sequence | Start of a project, or right after interviews |
| Customer journey map | One user’s path through a product or service | Chronological | Any stage, as a shared reference |
| Persona | An archetypal user, written up to last | No sequence | After research, to guide decisions for months |
A common order is empathy maps first, a persona built from them, then a journey map for that persona. Gray suggests another next step: feed the finished map into Strategyzer’s Value Proposition Canvas, whose customer profile lists jobs, pains and gains.
What the research says
The research base is thin and mostly about perceived usefulness. Cairns and colleagues found that medical students and patient partners valued the exercise, but wrote that further research is needed to confirm that empathy maps increase empathy. Peixoto and Moura adapted it into a Health Empathy Map for Brazilian medical training. In software, Ferreira, Santos and Conte wrote that the original “is not focused on software development” and built an adaptation called PATHY; their participants worried that imagined personas may not match real users. Ramos and colleagues used empathy maps from 61 users’ answers to build five personas, which users rated 3.7 out of 5 for representing them.
The empathy map, then, organizes evidence a team already has, and its value depends on the research brought to it. In our Growth Lab work an inferred pain on the map becomes a hypothesis, with a test and a date to check it.
How to apply Empathy map, step by step
- Name who and the goal. Write who you are mapping, the situation they are in and their role in it. Then write what they need to do, framed as something you could observe, and how you would know they succeeded. Result: the top two boxes of the canvas, which every note below must relate to.
- Gather evidence before the session. Collect interview transcripts, call recordings, support tickets, reviews and analytics for that one person or segment. Nielsen Norman Group asks that every note trace back to a source. Result: a pile of real material, not opinions.
- Go clockwise around the outside. Fill See, Say, Do and Hear in that order, as the 2017 canvas numbers them. Each person writes notes alone first, then the group posts them. Use verbatim quotes in Say. Result: the observable part of the map, the four sections you can check against the research.
- Move inside the head last. Only after the outside is full, infer what the person thinks and feels: their fears and frustrations (pains) and their hopes and needs (gains). Mark which notes are inferred and which come straight from a source. Result: the centre of the map, with guesses labelled as guesses.
- Look for gaps and contradictions. Step back and look for sections with few notes, and for places where what people say clashes with what they do. A thin section tells you what to research next; a clash often points to an unmet need. Result: two or three insights and a short list of open questions.
- Date it and put it to use. Write the date, the sources and a version number on the map. Turn the insights into decisions, such as a message to test, a step to remove or a question for the next round of interviews, each with an owner. Result: a map that changes work and can be updated as research comes in.
Examples
Medical students learning to take the patient's view
Cairns and colleagues added empathy map training to first-year communication skills teaching at two UK medical schools and reported it in The Clinical Teacher in 2021. They interviewed 28 participants: 16 students and 12 patient partners who helped with the training. Both groups saw value in the exercise, and students said it made them think more about patient-centred care. The authors called it a possible low-cost tool and said more research is needed to show it raises empathy.
A payment provider mapping merchants who leave
Illustrative. A payment provider for online shops sees small merchants cancel within three months. The team reads 40 cancellation tickets and interviews 8 merchants who left. Goal box: the merchant connects the provider and takes a first payment within a week. See: a dashboard full of compliance requests. Hear: other shop owners warning that payouts get held. Say: 'I just want to sell.' Do: abandons onboarding at the document upload step. Think and feel: afraid of having money frozen. The map turns the churn question into one concrete fix to test: explain payout holds before asking for documents.
A clinic front desk before a booking redesign
Illustrative. A private clinic plans to move phone bookings online. Two receptionists and the operations lead build a map of a first-time patient from 30 recorded calls. The Say section fills with questions about price and which doctor to see; Do shows that most callers ring back after visiting the website. The team infers the patient is anxious about choosing the wrong specialist and paying for it, so the online booking flow starts with symptoms and shows prices before asking for a time slot.
When to use it
Use it at the start of a project, right after a round of interviews, to sort notes and agree on one picture of the customer. It also works when a team argues about what customers want, before writing a value proposition, or when a new team member needs a quick view of a segment.
When not to use it
Skip it when you have no research and nobody who has spoken to customers recently: the map will only record the team's assumptions. It does not show steps over time, so use a journey map for a process. It also cannot size a market or prove demand; it describes a mindset, not how many people share it.
Common mistakes
- Filling it from imagination. NN/g lists mapping assumptions and treating them as evidence as the first mistake. Mark inferred notes and trace the rest to a source.
- Mapping a segment that is too broad. 'Small business owners' produces contradictory notes. Map one role in one situation.
- Jumping straight to think and feel. Gray's canvas puts the head last on purpose, so the team first looks at what can be observed.
- Treating it as a one-off poster. A map with no date and no owner goes stale; revise it after each round of research.
- Stopping at the map. Without insights, open questions and owners, the session is a pleasant workshop and nothing more.
FAQ
What is an empathy map?
An empathy map is a one-page canvas that records what a person or customer type sees, hears, says and does, and what they probably think and feel. Teams build it from research to share one view of the customer. The method came from the design firm XPLANE and was published in the 2010 book Gamestorming.
What questions does an empathy map ask?
Dave Gray's 2017 canvas starts with who the person is, their situation and role, and what they need to do. It then asks what they see in their environment, what they say, what they do today, and what they hear from friends and colleagues. Last it asks about their fears and frustrations, and their wants, needs and hopes.
How do you make an empathy map of your target audience?
Pick one customer type and one goal, not the whole audience. Gather interview notes, reviews and support tickets. Fill the outside sections first, see, say, do and hear, using quotes and observed behaviour. Then infer thoughts and feelings, look for gaps and contradictions, and turn them into questions or changes to test.
What is the difference between an empathy map and a persona?
An empathy map is a working tool for sorting research about one user type at a given moment. A persona is a finished, longer-lived profile of an archetypal user. NN/g describes aggregated empathy maps as a step toward personas and says they do not replace them. Many teams build several maps, then write the persona from them.
What are the four quadrants of an empathy map?
The common four-quadrant version, used by IDEO and Nielsen Norman Group, has says, does, thinks and feels around the user. Says and does hold what you heard and observed; thinks and feels hold what you infer. XPLANE's own canvas also has see and hear sections, plus pains and gains inside the head.
Sources
- Dave Gray, Updated Empathy Map Canvas, The XPLANE Collection (Medium), July 2017 (Internet Archive copy)
- Dave Gray, Empathy Map Canvas (PDF), XPLANE, last updated 16 July 2017 (copy hosted by UCLA MCH Nutrition Partners)
- Tim May, XPLANE, The Empathy Map: a human-centered tool for understanding how your audience thinks, 2021
- XPLANE, Empathy Map
- Gamestorming, Empathy Map
- Tom Kelley and David Kelley, Reclaim Your Creative Confidence, Harvard Business Review, December 2012
- Tom Kelley, IDEO, Build Your Creative Confidence: Empathy Maps, 2018
- Rachel Krause and Sarah Gibbons, Nielsen Norman Group, Empathy Mapping: The First Step in Design Thinking
- Sarah Gibbons, Nielsen Norman Group, UX Mapping Methods Compared: A Cheat Sheet, 2017
- Sarah Gibbons, Nielsen Norman Group, Journey Mapping 101
- Atlassian Team Playbook, Empathy mapping
- Strategyzer, The Value Proposition Canvas
- Hasso Plattner Institute of Design at Stanford, An Introduction to Design Thinking: Process Guide
- Center for Care Innovations, Catalyst method: empathy mapping
- NSW Government, Digital NSW design system, Empathy mapping
- NHS Education for Scotland, Turas Learn, Empathy mapping
- Washington State, Your Washington customer experience resources, Empathy mapping
- Patrick Cairns, India Pinker, Andrew Ward, Evelyn Watson, Anita Laidlaw, Empathy maps in communication skills training, The Clinical Teacher 18(2), 2021
- Maria Peixoto, Eliane Moura, Health Empathy Map: creation of an instrument for empathy development, Revista Brasileira de Educação Médica 44(1), 2020
- Bruna Ferreira, Gleison Santos, Tayana Conte, Identifying Possible Requirements using Personas: A Qualitative Study, ICEIS 2017
- Henrique Ramos, Mateus Fonseca, Lesandro Ponciano, Modeling and Evaluating Personas with Software Explainability Requirements, HCI-COLLAB 2021 (arXiv)
Last updated Oct 9, 2026


Marketing agency or growth system: when a company outgrows its agency
An agency is the right call while the founder still runs most of the company. Once the business starts copying itself into new locations or markets, it needs a system that sets goals, tests hypotheses and owns the result.

Why healthcare marketing agencies stall: the short, mid and long wins model we use with clinics
Most agencies own the click and nobody owns the front desk. How we structure clinic work in three horizons, the research behind each one, and one year of results.

Why channel tests stall after month three
Most paid channel tests do not end with a decision. They end when the budget runs out, the attribution model changes, or everyone quietly stops looking at the dashboard.