Diffusion of innovations
Diffusion of innovations is Everett Rogers' theory of how a new product or idea spreads through a group of people over time, who adopts it first, and what makes the spread fast or slow.
Diffusion of innovations is a theory, set out by sociologist Everett Rogers in his 1962 book, of how a new idea or product spreads through a group of people over time. It sorts adopters into five groups, from innovators to laggards, and names five qualities that speed adoption up or slow it down. Marketers use it to decide whom to sell to first and what to fix before a launch.
- Origin
- Everett M. Rogers; Bass model by Frank M. Bass, 1962 (book); 1969 (Bass model); 5th edition 2003
- Level
- 201 · Tool
- Fits
- Startup, Small and mid-size, Scale-up
- Time to apply
- two to three hours for a first launch plan, then a monthly check of the adoption curve
- What you need
- a clear description of the new product, feature or practice and who could adopt it · a list of current customers or prospects you can sort by how early they tend to try new things · monthly adoption counts once the launch starts
Diffusion of innovations is a theory of how a new idea, product or practice spreads through a group of people over time. Everett Rogers, a rural sociologist trained at Iowa State, set it out in his book Diffusion of Innovations, published by the Free Press in 1962. The fifth edition came out in 2003, the year before he died, according to the University of New Mexico’s student paper.
Rogers did not start from nothing. Valente and Rogers trace the research tradition to two Iowa State sociologists, Bryce Ryan and Neal Gross, whose 1943 study followed farmers taking up hybrid seed corn. Today the theory is used by marketers planning launches, by health systems spreading new practices and by forecasters estimating sales of new categories.
What the theory says
In Rogers’ definition, as Dearing quotes it, diffusion is the process by which an innovation is “communicated through certain channels” over time among the members of a social system. That sentence holds four parts you can plan around: the innovation itself, the channels people hear about it through, time, and the group of people who could adopt it.
The central observation is a shape. Plot the running total of adopters in a group and you usually get an S: slow at first, then fast, then flat as few people are left. Dearing attributes the steep middle to opinion leaders, the people others watch and ask, who talk about and model the new behavior.
What are the five adopter categories?
Rogers sorts adopters into five groups by how early they adopt compared with everyone else in the same group. In the shares usually quoted from his book, and reproduced in a 2017 review in the Journal of the American Dental Association, innovators are the first 2.5%, early adopters the next 13.5%, the early majority 34%, the late majority 34% and laggards the last 16%.
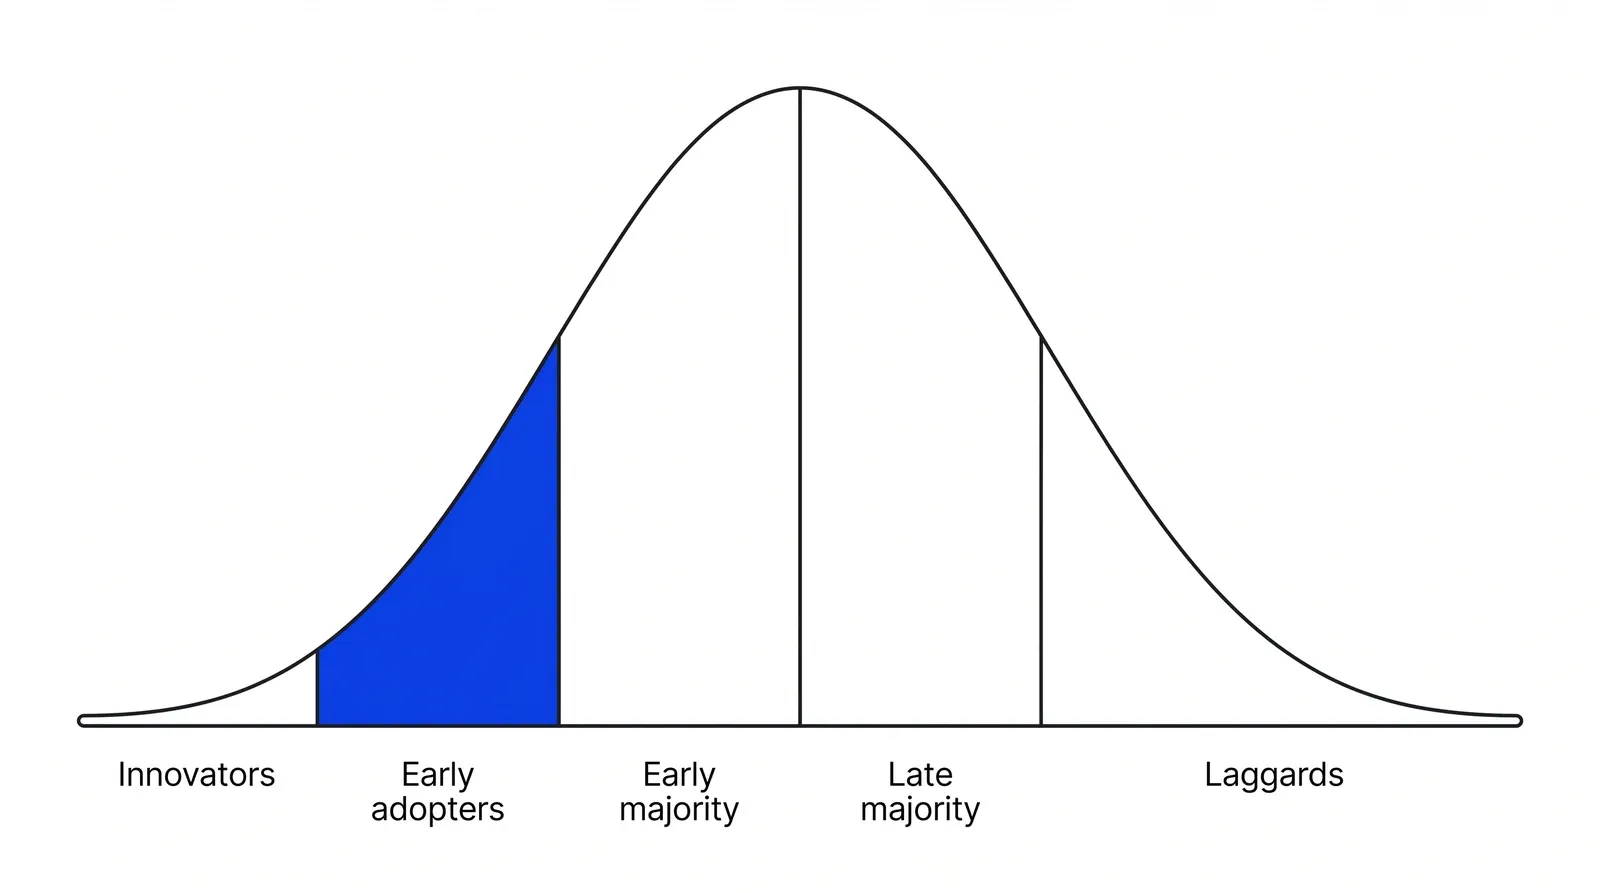
The precise-looking numbers come from geometry, not surveys. If adoption times follow a normal bell curve, cutting it at one and two standard deviations either side of the average gives roughly these shares. So treat them as a vocabulary, not a forecast. The groups also predate Rogers in rougher form: Valente’s 1996 paper notes that Ryan and Gross already grouped farmers into early adopters, early and late majority, and laggards.
| Group | Share | Typical traits, per the JADA summary of Rogers |
|---|---|---|
| Innovators | 2.5% | Want change, cope well with uncertainty, seen as slightly radical |
| Early adopters | 13.5% | Opinion leaders who bring new ideas into the group |
| Early majority | 34% | Adopt after deliberation |
| Late majority | 34% | Skeptical; adopt under pressure from peers |
| Laggards | 16% | Least connected; suspicious of change agents; last to change |
Five attributes that set the speed
Rogers names five qualities of an innovation that explain why some spread fast and others crawl. Each is judged from the adopter’s side, not the seller’s. The JADA review and Dearing define them in similar terms:
- Relative advantage: how much better it seems than the idea it replaces.
- Compatibility: how well it fits existing values, habits and past experience.
- Complexity: how hard it is to understand and use; simpler spreads faster.
- Trialability: whether people can try it on a small scale first.
- Observability: whether others can see the results.
They do not weigh the same. Dearing reports Rogers’ view that relative advantage, simplicity and compatibility explain most of the difference, while trialability and observability matter less consistently. For a launch plan, that argues for fixing a clash with how customers already work before adding a free trial.
The Bass model: putting numbers on the S-curve
The Bass model is a formula for forecasting first purchases of a new product. Frank Bass published it in Management Science in 1969. Its core assumption is that the timing of a buyer’s first purchase depends on how many people have already bought. Some buyers adopt on their own, which Bass called innovative behavior; the rest imitate those who went before.
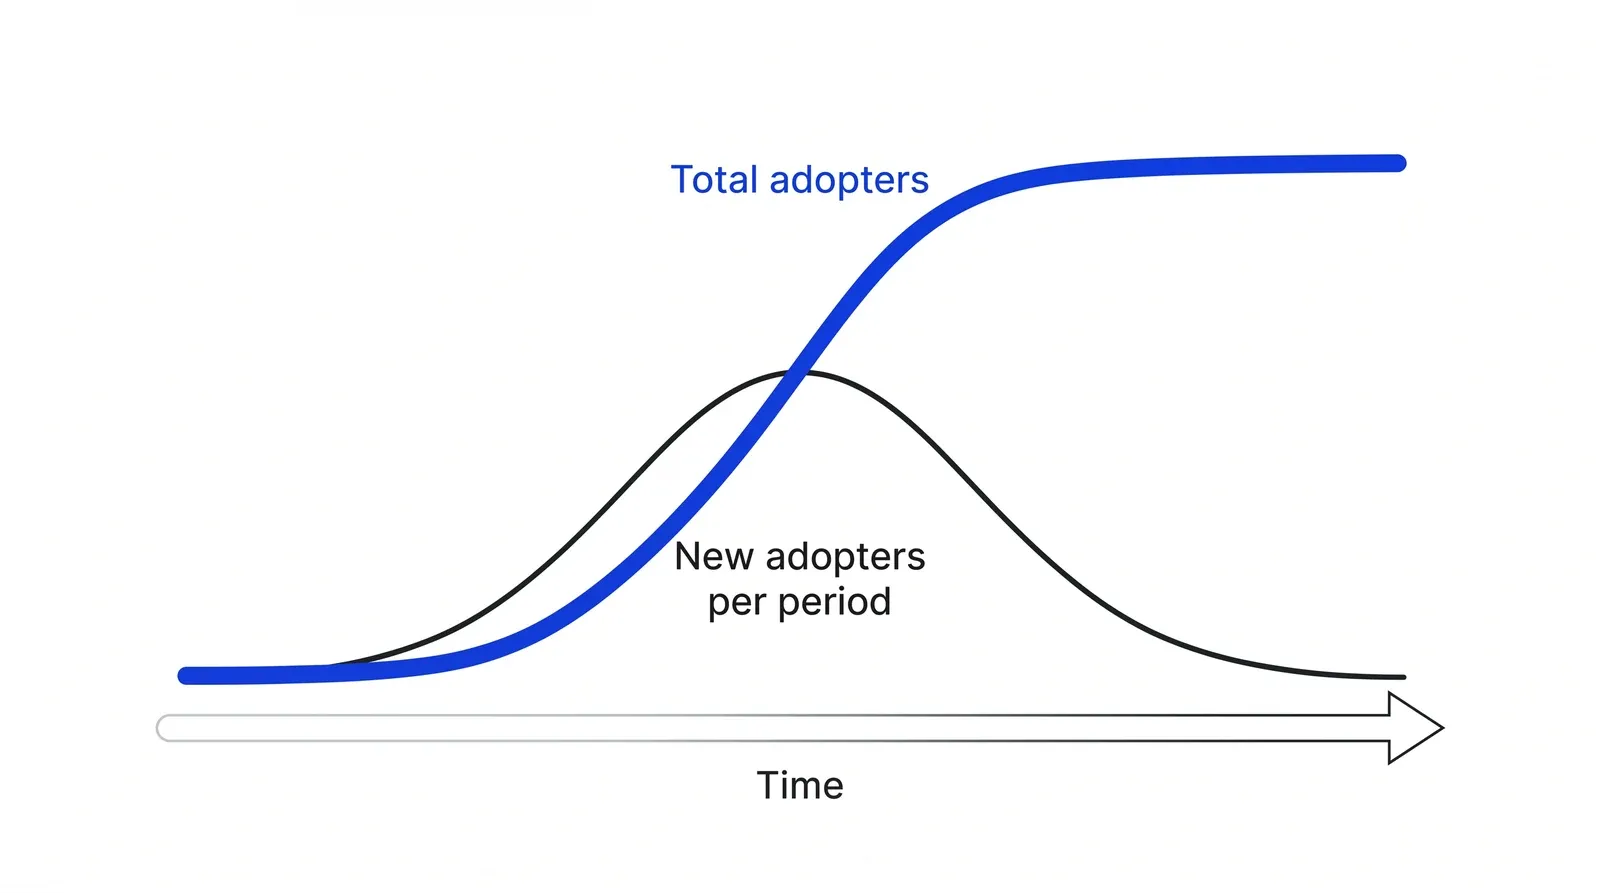
In its usual form, the share of remaining non-adopters who buy in a period equals p + q × F, where p is the coefficient of innovation, q the coefficient of imitation and F the share who have already adopted. Bass tested it on eleven consumer durables and used it to forecast color TV sales. INFORMS members later voted it one of the ten most influential papers in the journal’s first 50 years, Bass wrote in a 2004 commentary.
The model links back to Rogers. Mahajan, Muller and Srivastava showed in 1990 that adopter categories can be drawn from a fitted Bass curve instead of the idealized bell. A meta-analysis of 213 applications found that the parameters vary with the product, the country and how the model is estimated, so values borrowed from another product are only a rough starting point.
Where Moore’s chasm fits
Geoffrey Moore’s Crossing the Chasm, published in 1991, is a later extension aimed at technology companies. He argues that adoption does not flow smoothly from early adopters to the early majority. Early adopters buy into a vision; pragmatists, as Moore’s own page puts it, “want to see it proven out first”. In his account, products that win the first group often stall before reaching the second.
There is evidence for a dip. Goldenberg, Libai and Muller studied consumer electronics and found that between one-third and one-half of the sales cases showed a “saddle”: an early peak, a trough, then sales above the first peak. They explain it by the early market and the main market adopting at different speeds.
| Idea | Question it answers | Source |
|---|---|---|
| Diffusion of innovations | Who adopts in what order, and what speeds it up | Rogers, 1962 |
| Bass model | How many will buy each period | Bass, 1969 |
| Crossing the chasm | Why tech sales stall after early adopters | Moore, 1991 |
| Disruptive innovation | How a cheaper entrant overtakes incumbents | Christensen, 1990s |
Limits to keep in mind
The theory grew from voluntary, individual decisions, like a farmer choosing seed. It fits less neatly when an organization decides for everyone. Berwick adds managerial and contextual factors to Rogers’ list when applying it inside hospitals, and Greenhalgh and colleagues built a separate model for health service organizations. Rogers himself reviewed the field’s shortcomings for product marketers in a 1976 paper.
In our Growth Lab work, the theory is most useful early: to pick the first accounts, find the weakest attribute and agree on what proof the majority will need.
How to apply Diffusion of innovations, step by step
- Define the innovation and the group. Write down what exactly is new and who could adopt it: every merchant on your platform, the 40 clinicians in one department, small importers in one country. Diffusion is always measured inside a defined group. Result: one sentence naming the innovation and the population, with its size.
- Score the five attributes from the adopter's side. Rate relative advantage, compatibility, complexity, trialability and observability from 1 to 5 as a typical adopter would see them, using interviews or sales call notes, not the product team's opinion. Result: a five-line scorecard with the weakest attribute marked.
- Fix the weakest attribute before launch. If trial is hard, offer a free month or a pilot on one site. If results are invisible, build a report the adopter can show a colleague. If it clashes with current workflow, add the integration first. Result: one or two changes that raise the lowest score.
- Name your innovators and early adopters. Pick the people or accounts most likely to try it first, then find the respected ones among them, the people others ask for advice. Berwick's advice to health care leaders was to support innovators and invest in early adopters. Result: a short named list for the first wave, with an owner for each.
- Plan the move to the early majority. Write down what a cautious, practical buyer will need that an enthusiast will not: references from similar companies, a complete product, support, a clear price. This is the gap Moore called the chasm. Result: a list of proof points to collect from the first wave.
- Track the curve every month. Plot new adopters per month and the running total. Compare it with an S-curve, or fit a simple Bass model once you have several months of data. A stall after a promising start is the warning sign. Result: a monthly chart and a decision on whether to change the plan.
Examples
Hybrid seed corn in Iowa
According to James Dearing's 2009 review, the study that set the pattern for diffusion research was Bryce Ryan and Neal Gross's 1943 paper on how farmers in two Iowa communities took up hybrid seed corn. It treated each farmer as the one who decides, adoption as the outcome to measure, and extension agents as the change agents. Rogers trained in the same Iowa State tradition; according to the university's Greenlee School, he took his PhD there in 1957.
A new antibiotic among physicians
According to their Sociometry paper, James Coleman, Elihu Katz and Herbert Menzel reported in 1957 on how doctors began prescribing tetracycline, then a new antibiotic. A 2017 review in the Journal of the American Dental Association summarizes the finding: willingness to prescribe it spread through doctors' professional contacts. For a healthcare launch, the lesson is that respected colleagues move adoption more than mailings do.
Instant payouts for merchants
Illustrative, no real company implied. A payments platform launches instant payouts to its 800 merchants. Suppose one in a hundred merchants who have not yet adopted switch on their own each month (p = 0.01), and imitation adds 0.3 times the share already using it (q = 0.3). Month one brings 8 adopters (800 x 0.01). In month two the rate is 0.01 + 0.3 x 0.01 = 0.013, applied to the 792 left, so about 10 more. Monthly additions keep growing as each adopter recruits others, until the pool of non-adopters runs low.
When to use it
Use it when you launch a new product, feature or internal practice and need to decide whom to target first, what to fix before launch and how fast to expect uptake. It also helps forecast sales of a new category once a few months of data exist.
When not to use it
Do not use the percentages as a forecast for a specific product: they are slices of an idealized curve, not measurements. It also fits poorly when adoption is not voluntary, such as a regulation everyone must follow by a date, or when one central buyer decides for a whole organization.
Common mistakes
- Treating 2.5% or 16% as targets. They are slices of an idealized curve; according to Mahajan, Muller and Srivastava (1990), categories drawn from a fitted curve for a real product come out different.
- Scoring the five attributes from the seller's point of view. The theory is about how adopters perceive the innovation.
- Assuming early adopter enthusiasm will carry over to the majority. Moore's chasm and the saddle pattern found by Goldenberg, Libai and Muller show how sales can stall in between.
- Calling late adopters irrational. They often have less budget, more risk or a better reason to wait.
- Ignoring who talks to whom. The tetracycline study showed adoption following professional networks.
FAQ
What are the five adopter categories in diffusion of innovations?
Innovators, the first 2.5% to adopt, followed by early adopters at 13.5%, the early majority at 34%, the late majority at 34% and laggards at 16%. The shares come from slicing a bell curve of adoption times at one and two standard deviations from the average, so they describe an idealized market.
What are the five attributes of an innovation according to Rogers?
Relative advantage, how much better it seems than what it replaces; compatibility, how well it fits existing values and habits; complexity, how hard it is to understand and use; trialability, whether it can be tried on a small scale; and observability, whether others can see the results.
Who developed the diffusion of innovations theory?
Everett Rogers, a sociologist trained at Iowa State, brought earlier studies together in his book Diffusion of Innovations. According to library records, it was first published in 1962, and the fifth edition followed in 2003. The research tradition began earlier, with Ryan and Gross's 1943 study of hybrid seed corn among Iowa farmers.
What is the difference between diffusion of innovations and crossing the chasm?
Rogers' theory describes how adoption spreads through all five groups as one continuous curve. Geoffrey Moore's 1991 book Crossing the Chasm argues that for technology products there is a gap between early adopters, who buy the vision, and the pragmatic early majority, who want proof first.
What is the Bass diffusion model?
It is a forecasting model that Frank Bass published in Management Science in 1969, according to the journal record. It assumes each period's new buyers come from two forces: innovators who adopt on their own and imitators influenced by the number of people who already bought. Bass tested it on eleven consumer durables.
Sources
- Everett M. Rogers, Diffusion of Innovations, Free Press of Glencoe, 1962, UW-Madison Libraries record
- Everett M. Rogers, Diffusion of Innovations, 5th edition, Free Press, 2003, Internet Archive record
- Daily Lobo, University of New Mexico, Professor's story remembered, October 2004
- Greenlee School of Journalism and Communication, Iowa State University, 2008: Everett M. Rogers
- Thomas W. Valente, Everett M. Rogers, The Origins and Development of the Diffusion of Innovations Paradigm as an Example of Scientific Growth, Science Communication 16(3), 1995
- Everett M. Rogers, New Product Adoption and Diffusion, Journal of Consumer Research 2(4), 1976
- James W. Dearing, Applying Diffusion of Innovation Theory to Intervention Development, Research on Social Work Practice 19(5), 2009
- Rachel B. Ramoni et al., Adoption of dental innovations: the case of a standardized dental diagnostic terminology, Journal of the American Dental Association, 2017
- James Coleman, Elihu Katz, Herbert Menzel, The Diffusion of an Innovation Among Physicians, Sociometry 20(4), 1957
- Thomas W. Valente, Social network thresholds in the diffusion of innovations, Social Networks 18(1), 1996
- Zvi Griliches, Hybrid Corn: An Exploration in the Economics of Technological Change, Econometrica 25(4), 1957
- Donald M. Berwick, Disseminating Innovations in Health Care, JAMA 289(15), 2003
- Trisha Greenhalgh et al., Diffusion of Innovations in Service Organizations: Systematic Review and Recommendations, Milbank Quarterly 82(4), 2004
- Rita McGrath, The Pace of Technology Adoption Is Speeding Up, Harvard Business Review, November 2013
- Frank M. Bass, A New Product Growth for Model Consumer Durables, Management Science 15(5), 1969
- Frank M. Bass, Comments on A New Product Growth for Model Consumer Durables: The Bass Model, Management Science 50(12 supplement), 2004
- Vijay Mahajan, Eitan Muller, Frank M. Bass, New Product Diffusion Models in Marketing: A Review and Directions for Research, Journal of Marketing 54(1), 1990
- Vijay Mahajan, Eitan Muller, Rajendra K. Srivastava, Determination of Adopter Categories by Using Innovation Diffusion Models, Journal of Marketing Research 27(1), 1990
- Fareena Sultan, John U. Farley, Donald R. Lehmann, A Meta-Analysis of Applications of Diffusion Models, Journal of Marketing Research 27(1), 1990
- Renana Peres, Eitan Muller, Vijay Mahajan, Innovation diffusion and new product growth models: A critical review and research directions, International Journal of Research in Marketing 27(2), 2010
- Geoffrey A. Moore, Crossing the Chasm, HarperBusiness, 1991, UW-Madison Libraries record
- Geoffrey A. Moore, Crossing the Chasm, author's book page
- Jacob Goldenberg, Barak Libai, Eitan Muller, Riding the Saddle: How Cross-Market Communications Can Create a Major Slump in Sales, Journal of Marketing 66(2), 2002
Last updated Oct 9, 2026


Marketing agency or growth system: when a company outgrows its agency
An agency is the right call while the founder still runs most of the company. Once the business starts copying itself into new locations or markets, it needs a system that sets goals, tests hypotheses and owns the result.

Why healthcare marketing agencies stall: the short, mid and long wins model we use with clinics
Most agencies own the click and nobody owns the front desk. How we structure clinic work in three horizons, the research behind each one, and one year of results.

Why channel tests stall after month three
Most paid channel tests do not end with a decision. They end when the budget runs out, the attribution model changes, or everyone quietly stops looking at the dashboard.