Growth accounting
Growth accounting splits the change in active users or recurring revenue into what was gained (new, resurrected, expansion) and what was lost (churned, contraction), so a team can see whether growth comes from a healthy base or from refilling a leaky one.
Growth accounting is a method for breaking the change in active users or revenue between two periods into new, retained, resurrected and churned parts, plus expansion and contraction for revenue. Jonathan Hsu set it out in the Diligence at Social Capital series of 2015. Its summary statistic, the quick ratio, divides what was gained by what was lost.
- Origin
- Jonathan Hsu (growth accounting, Social Capital); Mamoon Hamid (SaaS quick ratio), 2015
- Level
- 301 · Advanced
- Fits
- Scale-up
- Time to apply
- Half a day to write the query; then one reading per month
- What you need
- an event log or billing table with a user or customer ID and a date for every active day or payment · one agreed definition of active (the core action, not just a login) or of recurring revenue · at least six months of history, so the trend is visible
Growth accounting is a way of explaining why an active user count or a recurring revenue line moved between two periods. Instead of one number going up, you get the parts: users you gained for the first time, users who came back, users who stayed, and users you lost. Jonathan Hsu, then a partner at Social Capital and earlier part of Facebook’s data science team, published it in September 2015 as the first post of the Diligence at Social Capital series. The firm used it to judge product-market fit before investing, and several of its portfolio companies ran it as an operating report.
The idea came from Facebook practice. In the series epilogue, Hsu says the work began in late 2014, when the team wanted the same product metrics for startups that they had used at Facebook. Growth accounting became one of three parts of what they called the 8-ball, next to cohort analysis and the distribution of usage across customers.
The two identities behind growth accounting
Growth accounting rests on two equations that must always balance. Every user active this month is either new, retained from last month, or resurrected from some earlier month. Every user active last month either stayed (retained) or left (churned). Hsu calls this split “mutually exclusive and completely exhaustive.”
MAU(t)     = new(t) + retained(t) + resurrected(t)
MAU(t - 1) = retained(t) + churned(t)

MAU(t) - MAU(t - 1) = new(t) + resurrected(t) - churned(t)
Subtract the second from the first and retained users cancel out. Growth is new plus resurrected minus churned. Divide each term by last month’s total and you get rates: growth rate roughly equals new rate plus resurrection rate minus churn rate, as Hsu shows in his 2019 Amplitude post.
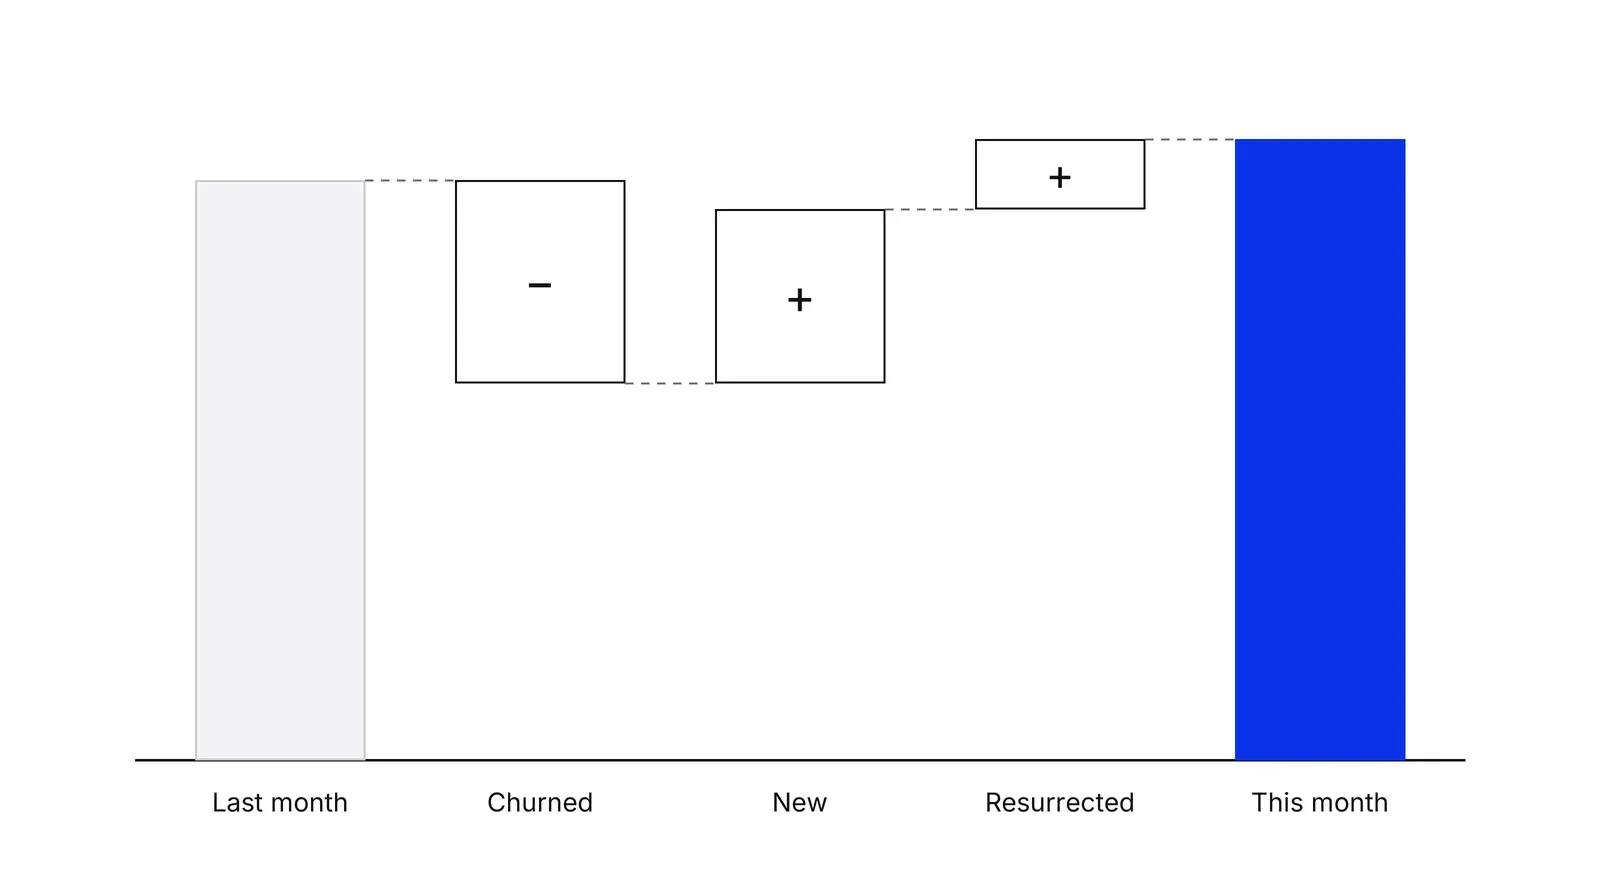
Worked example: monthly active users
Take a budgeting app (illustrative numbers) and run Hsu’s identities on one month. March closes with 10,000 active users. April’s labels look like this, with a second app, App B, added for comparison:
| Term | App A, April | App B, April |
|---|---|---|
| Retained from March | 6,500 | 9,000 |
| Churned since March | 3,500 | 1,000 |
| New | 3,000 | 1,500 |
| Resurrected | 1,200 | 200 |
| MAU, April | 10,700 | 10,700 |
For App A, the identity checks out: 6,500 + 3,000 + 1,200 = 10,700, and 3,000 + 1,200 - 3,500 = 700 = 10,700 - 10,000. Growth is 7% for the month. The ratios follow from the same table:
- Gross retention: 6,500 / 10,000 = 65%
- Quick ratio: (3,000 + 1,200) / 3,500 = 1.2
- Net churn: (3,500 - 1,200) / 10,000 = 23%
- Rate check: 30% new + 12% resurrected - 35% churn = 7%
A quick ratio of 1.2 means the app adds about six users for every five it loses. By Hsu’s yardstick in Part 1 that is ordinary for a consumer app, which he says tends to sit “just above 1.”
Same growth, different business
The reason to do growth accounting is that the same headline growth can hide very different products. Hsu’s first post builds two fictional apps with identical MAU curves, one retaining about 40% of users each month and the other far more.
App B in the table is the second kind. It also ends April at 10,700, but its quick ratio is (1,500 + 200) / 1,000 = 1.7 and its retention is 90%.
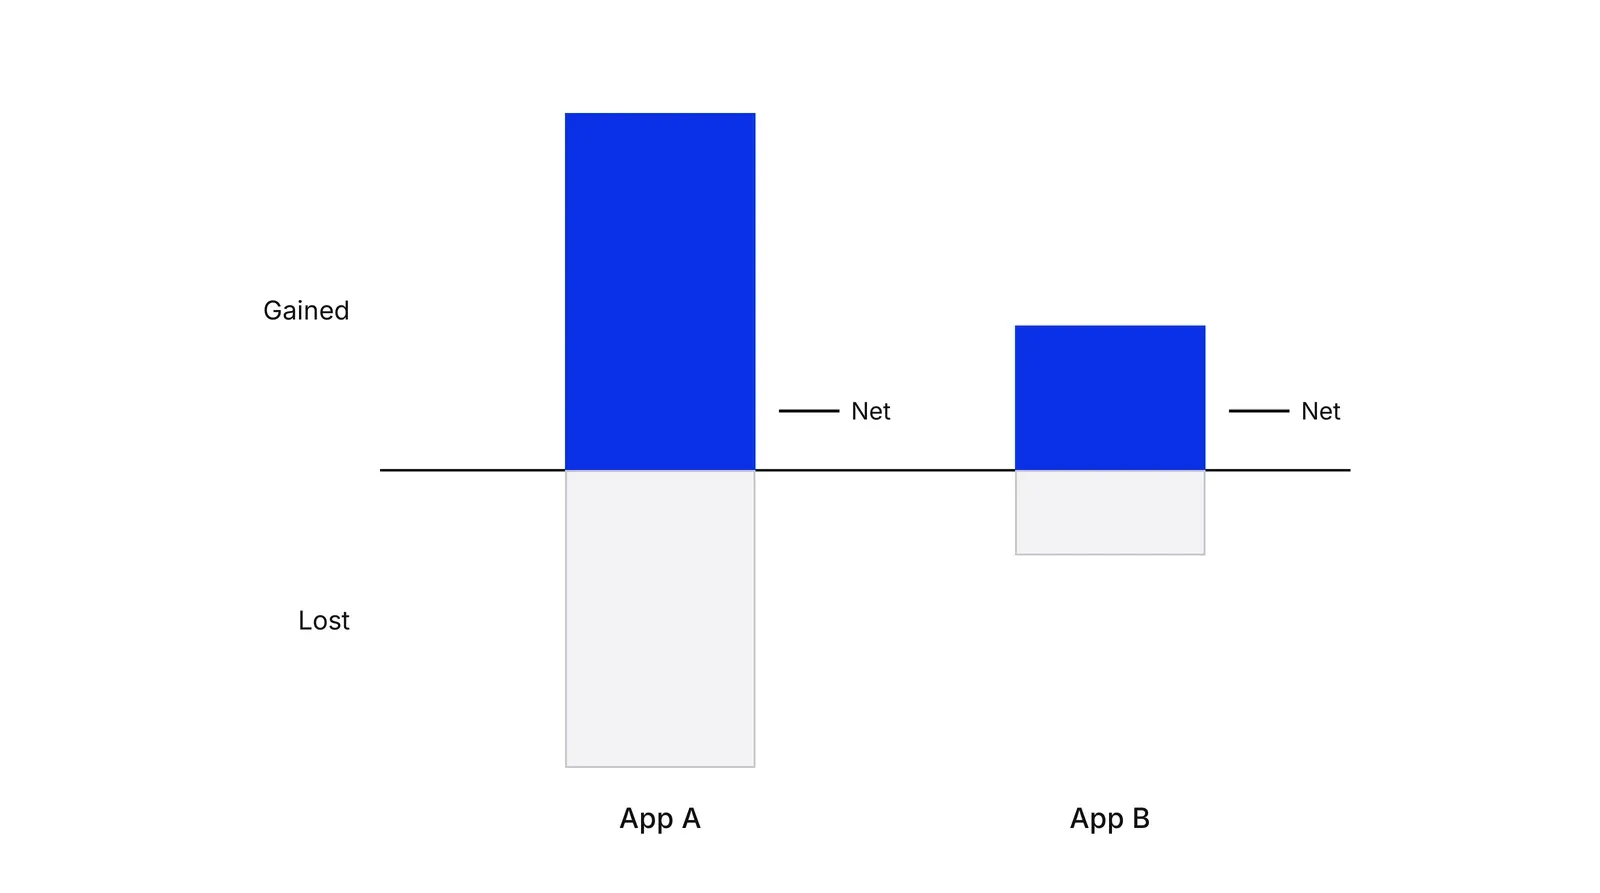
Hsu would rather back App B. With high retention, each extra user bought through ads or referrals stays, so pushing acquisition pays. With App A, much of what you buy leaks out the next month. In his words, it is easier to fill the top of the funnel than to fix an underlying churn problem.
Revenue: adding expansion and contraction
For recurring revenue, a customer can stay but pay more or less. Hsu’s second post adds two terms. If a customer pays $10 one month and $12 the next, $10 counts as retained and $2 as expansion. Churn counts only when a customer goes to zero.
MRR(t)     = new(t) + retained(t) + resurrected(t) + expansion(t)
MRR(t - 1) = retained(t) + churned(t) + contraction(t)
Take a B2B payments platform (illustrative) and apply the Tribe Capital formulas:
| Term | This month |
|---|---|
| MRR last month | $200,000 |
| New | $20,000 |
| Resurrected (returning customers) | $2,000 |
| Expansion | $8,000 |
| Churned | $6,000 |
| Contraction | $3,000 |
| Retained: 200,000 - 6,000 - 3,000 | $191,000 |
| MRR this month: 191,000 + 20,000 + 2,000 + 8,000 | $221,000 |
- Gross retention: 191,000 / 200,000 = 95.5%
- Quick ratio, Tribe Capital version (counts resurrected): 30,000 / 9,000 = 3.3
- Quick ratio, Hamid version (new and expansion only): 28,000 / 9,000 = 3.1
- Net churn: (6,000 + 3,000 - 2,000 - 8,000) / 200,000 = -0.5%
Negative net churn means existing customers grow revenue even with zero new sales. Tribe Capital’s 2019 essay gives the same formula and calls negative net churn “a positive signal in any business.”
The quick ratio and its two definitions
Mamoon Hamid, a Social Capital co-founder now at Kleiner Perkins, introduced the SaaS quick ratio in his 2015 SaaStr deck: new plus expansion MRR divided by cancelled plus contraction MRR, with the advice to “Maintain a Quick Ratio > 4.” Hsu credits the term to that deck. Hamid later told a SaaStr audience that a ratio of 4 means losing about $1 for every $4 added, and that near 1 a company is on a treadmill.
The definitions differ in one place. Hsu’s user formula and Tribe’s revenue formula put resurrected users or revenue in the numerator. Hamid’s deck, ChartMogul, Baremetrics and Stripe use only new and expansion. In the example above, that moves the ratio from 3.3 to 3.1. Pick one and label it.
| Version | Numerator | Denominator | Usual bar |
|---|---|---|---|
| User quick ratio (Hsu) | new + resurrected | churned | just above 1 typical for consumer apps |
| SaaS quick ratio (Hamid) | new + expansion | churned + contraction | above 4 |
| Revenue quick ratio (Tribe) | new + resurrected + expansion | churned + contraction | above 1 means growth |
The 4 benchmark has a known blind spot. Tomasz Tunguz, who thanks Hamid for help with the analysis, calculated that a company growing 15% a month can hold a ratio of 4 with 5% monthly revenue churn, about 46% a year. Read the ratio next to gross retention.
Where you will meet it
Analytics tools build it in under other names. Amplitude’s Lifecycle chart labels users new, current, resurrected and dormant, and its Pulse view is (new + resurrected) / dormant, the user quick ratio. Duolingo’s growth model uses seven daily states and found that current users make up about 90% of DAU.
Growth accounting answers what moved. Cohort retention curves, covered on the product-market fit page, answer who left and when. In a Growth Lab style monthly review, the table belongs next to the AARRR funnel, because it shows whether the next budget should go to acquisition or to keeping the users already won.
How to apply Growth accounting, step by step
- Pick the unit and the window. Choose what you are counting: monthly active users, weekly active users, or monthly recurring revenue. Hsu notes several Social Capital portfolio companies used a rolling 28-day window to remove day-of-week effects. Result: one unit, one definition of active, one window length.
- Label every user in every period. For each period, tag each user or customer as new (first period ever), retained (active this period and last), resurrected (active now, inactive last period, active at some earlier point) or churned (active last period, not now). For revenue, split retained customers further into expansion and contraction. Result: a table with one label per user per period.
- Check the identity. This period's total must equal new plus retained plus resurrected (plus expansion for revenue), and last period's total must equal retained plus churned (plus contraction). If the numbers do not tie out, a label rule is wrong. Result: a reconciled table you can trust.
- Compute the ratios. Gross retention is retained divided by last period's total. The quick ratio is gains divided by losses. Net churn is losses minus resurrected (and expansion, for revenue), divided by last period's total. Result: three numbers per period, plotted as a monthly series.
- Read the mix, not the total. Plot gains as bars above zero and losses below it. Look at whether churn is growing faster than new users, whether resurrection is doing real work, and whether the quick ratio is trending up or down. Result: one sentence on where growth comes from and what threatens it.
- Decide where the next quarter goes. If retention is strong and the quick ratio high, spend on acquisition. If churn is eating most of the gains, fix retention first, because new users will leak out at the same rate. Result: a written choice between acquisition, retention and resurrection work.
Examples
Duolingo's growth model
In 2018 Duolingo's daily active users were growing in single digits a year. Former product chief Jorge Mazal describes how the team adapted Zynga's state model to a daily view: new, current, reactivated (back after 7 to 29 days), resurrected (back after 30 days or more), at-risk and dormant. Simulations showed the current user retention rate, CURR, had five times the impact on DAU of the next-best lever, so the company made it the North Star metric. Mazal reports DAU grew 4.5x over four years.
The SaaS companies in Mamoon Hamid's deck
Hamid's 2015 SaaStr deck shows four real but unnamed SaaS companies. One added $126 of new and expansion MRR against $32 cancelled, a quick ratio of 4.0. Another added $304 but lost $188 to cancellations and contraction, a ratio of 1.6. Describing the same slide, Hsu says one of the companies Social Capital passed on had large expansion revenue that was mostly eaten by contraction, so it had to keep expanding accounts just to stand still.
A telehealth app checking weekly users
Illustrative. A telehealth app counts weekly active patients: 8,000 last week. This week: retained 5,600, churned 2,400, new 1,800, returning after a gap 900, total 8,300. The quick ratio is (1,800 + 900) / 2,400 = 1.13 and weekly retention is 70%. Most of the 300-patient gain comes from refilling churn, so the team tests appointment reminders before raising its ad budget.
When to use it
Use it once a product has a few thousand active users or a few dozen paying customers and a clean event or billing log, and whenever someone shows a single growth line going up and to the right. It is also the first analysis Tribe Capital says it runs when it looks at a company.
When not to use it
Skip it for one-off purchases with no expected repeat, such as a home sale or a single surgery, where churn is the normal state. With very small numbers, one customer leaving swings the quick ratio wildly, so wait for more data or look at individual accounts instead.
Common mistakes
- Comparing a consumer MAU quick ratio with the SaaS benchmark of 4. Hsu reports consumer apps usually sit just above 1, and 1.5 to 2.0 is very good for them.
- Mixing quick ratio definitions. Some include resurrected users or reactivated revenue in the numerator, others do not; state which one you report.
- Using a weak definition of active, such as any app open, which inflates retained users and hides churn.
- Reading the quick ratio alone during fast growth. Tomasz Tunguz shows a ratio of 4 at 15% monthly growth still allows 5% monthly revenue churn.
- Stopping at growth accounting. It does not show whether the churners were last month's sign-ups or two-year customers; cohort analysis answers that.
FAQ
What is the quick ratio in growth accounting?
The quick ratio divides what a business gained in a period by what it lost. For users it is (new + resurrected) / churned. For SaaS revenue it is (new + expansion MRR) / (churned + contraction MRR). Above 1 the base is growing; below 1 it is shrinking. It has nothing to do with the accounting quick ratio of liquid assets to liabilities.
What is a good SaaS quick ratio?
Mamoon Hamid's 2015 deck tells SaaS founders to keep the quick ratio above 4, meaning $4 of new and expansion revenue for every $1 lost. Hsu wrote that a ratio below 2 usually means churn is too high. For consumer apps measured in active users, the bar is much lower: just above 1 is typical.
What is the difference between resurrected and new users?
A new user is active for the first time ever in this period. A resurrected user was active at some earlier point, was inactive last period, and came back this period. Keeping them apart matters because a resurrection campaign and an acquisition campaign need different budgets and messages.
How is growth accounting different from cohort analysis?
Growth accounting explains the change in the whole base between two periods. Cohort analysis follows a group that joined in the same month as it ages. Hsu's 2015 series points out that growth accounting cannot tell whether churners are recent sign-ups or long-time customers, which is the gap cohorts fill. Most teams run both.
Is this the same as growth accounting in economics?
No. In economics, growth accounting splits a country's output growth into contributions from labour, capital and technical progress, a method built on Robert Solow's 1957 paper. The product and startup version shares the name and the idea of decomposing growth, but it works on users and revenue.
Sources
- Jonathan Hsu, Diligence at Social Capital Part 1: Accounting for User Growth, 2015
- Jonathan Hsu, Diligence at Social Capital Part 2: Accounting for Revenue Growth, 2015
- Jonathan Hsu, Diligence at Social Capital Part 3: Cohorts and (revenue) LTV, 2015
- Jonathan Hsu, Diligence at Social Capital, Epilogue: Introducing the 8-ball and GAAP for Startups, 2016
- Tribe Capital, A Quantitative Approach to Product Market Fit, 2019
- Jonathan Hsu, How to analyze the health of your app's product-market fit through growth accounting, Amplitude, 2019
- Mamoon Hamid, SaaS Secrets to Raising Venture Capital, Social+Capital, SaaStr Annual 2015
- SaaStr, Mamoon Hamid: The Numbers That Actually Matter to Founders (transcript)
- Tomasz Tunguz, What is the optimal quick ratio for your SaaS startup? Is it 4?, 2015
- TechNet, Mamoon Hamid, Executive Council profile
- Alex Danco, An Interview with Jonathan Hsu from Tribe Capital, 2019
- Amplitude Docs, Interpret your Lifecycle chart
- Amplitude Docs, Lifecycle: track the growth of your product's user base
- ChartMogul, SaaS metrics library: Quick Ratio
- ChartMogul Help Center, Understanding MRR movements
- ChartMogul Help Center, Chart: MRR Movements
- Baremetrics Academy, SaaS Quick Ratio
- Stripe, The SaaS quick ratio: how to measure real growth efficiency
- Erin Gustafson, Meaningful metrics: how data sharpened the focus of product teams, Duolingo Blog, 2023
- Jorge Mazal, How Duolingo reignited user growth, Lenny's Newsletter, 2023
- Robert M. Solow, Technical Change and the Aggregate Production Function, Review of Economics and Statistics, 1957
- The Nobel Prize, Press release: The Prize in Economic Sciences 1987
Last updated Oct 9, 2026


Marketing agency or growth system: when a company outgrows its agency
An agency is the right call while the founder still runs most of the company. Once the business starts copying itself into new locations or markets, it needs a system that sets goals, tests hypotheses and owns the result.

Why healthcare marketing agencies stall: the short, mid and long wins model we use with clinics
Most agencies own the click and nobody owns the front desk. How we structure clinic work in three horizons, the research behind each one, and one year of results.

Why channel tests stall after month three
Most paid channel tests do not end with a decision. They end when the budget runs out, the attribution model changes, or everyone quietly stops looking at the dashboard.