Incrementality testing
Incrementality testing is a controlled experiment that shows how many sales a channel caused, as opposed to how many it was credited with, by comparing people or regions that saw the ads with a group that did not.
Incrementality testing is a controlled experiment that measures how many conversions an advertising channel actually caused. A random group of people or regions is kept from seeing the ads, and its results are compared with the group that saw them. The gap is the incremental lift. It answers whether a channel brings new customers or takes credit for ones who would have come anyway.
- Origin
- Field-experiment practice; geo experiments described by Jon Vaver and Jim Koehler (Google); ghost ads by Garrett Johnson, Randall Lewis and Elmar Nubbemeyer, 2011 geo experiments; 2017 ghost ads
- Level
- 301 · Advanced
- Fits
- Scale-up, Enterprise
- Time to apply
- two to four weeks of preparation, then a test of four to eight weeks per channel
- What you need
- at least a year of daily or weekly conversions, by region if you plan a geo test · a channel with enough spend that switching part of it off would show up in sales · one analyst who runs the power calculation before launch and the readout after · agreement from the budget owner to leave the control group alone for the whole test
Incrementality testing is a controlled experiment that measures how many conversions an advertising channel caused. You keep a random group of people or regions from seeing the ads, compare their results with the group that did see them, and treat the gap as the channel’s real contribution. Everything the control group bought anyway is demand the ads did not create.
The idea is older than digital advertising. In 1995 Leonard Lodish and colleagues published a meta-analysis of 389 split-cable TV experiments, in which households on the same cable network saw different ad plans. Online, Google researchers Jon Vaver and Jim Koehler described geo experiments in 2011, and Garrett Johnson, Randall Lewis and Elmar Nubbemeyer published the ghost ads method in 2017. Performance teams, growth leads and finance teams that have to defend an ad budget use it.
Attributed sales and incremental sales
Attributed sales are the conversions a platform or analytics tool credits to an ad. Incremental sales are the ones that would not have happened without it. The two can be far apart, because ads are aimed at people who are already likely to buy.
The clearest public case is eBay. In a field experiment published in Econometrica, Thomas Blake, Chris Nosko and Steven Tadelis stopped eBay’s brand keyword ads on Yahoo and MSN. The author version of the paper reports that 99.5% of the click traffic stayed, because people clicked the organic eBay link right below. For non-brand keywords, ads were switched off in about 30% of US regions for 60 days. A regression on spend and sales without experimental variation put the return at over 4,100%, and over 1,400% with region and day controls. The experiment put it at minus 63%, with a 95% confidence interval of minus 124% to minus 3%. Ads did move new and occasional buyers; frequent buyers, who would have purchased anyway, absorbed most of the spend.
Three ways to build a control group
The design depends on whether you can keep individual people from seeing ads, or only whole regions. Pick the strongest design the channel allows.
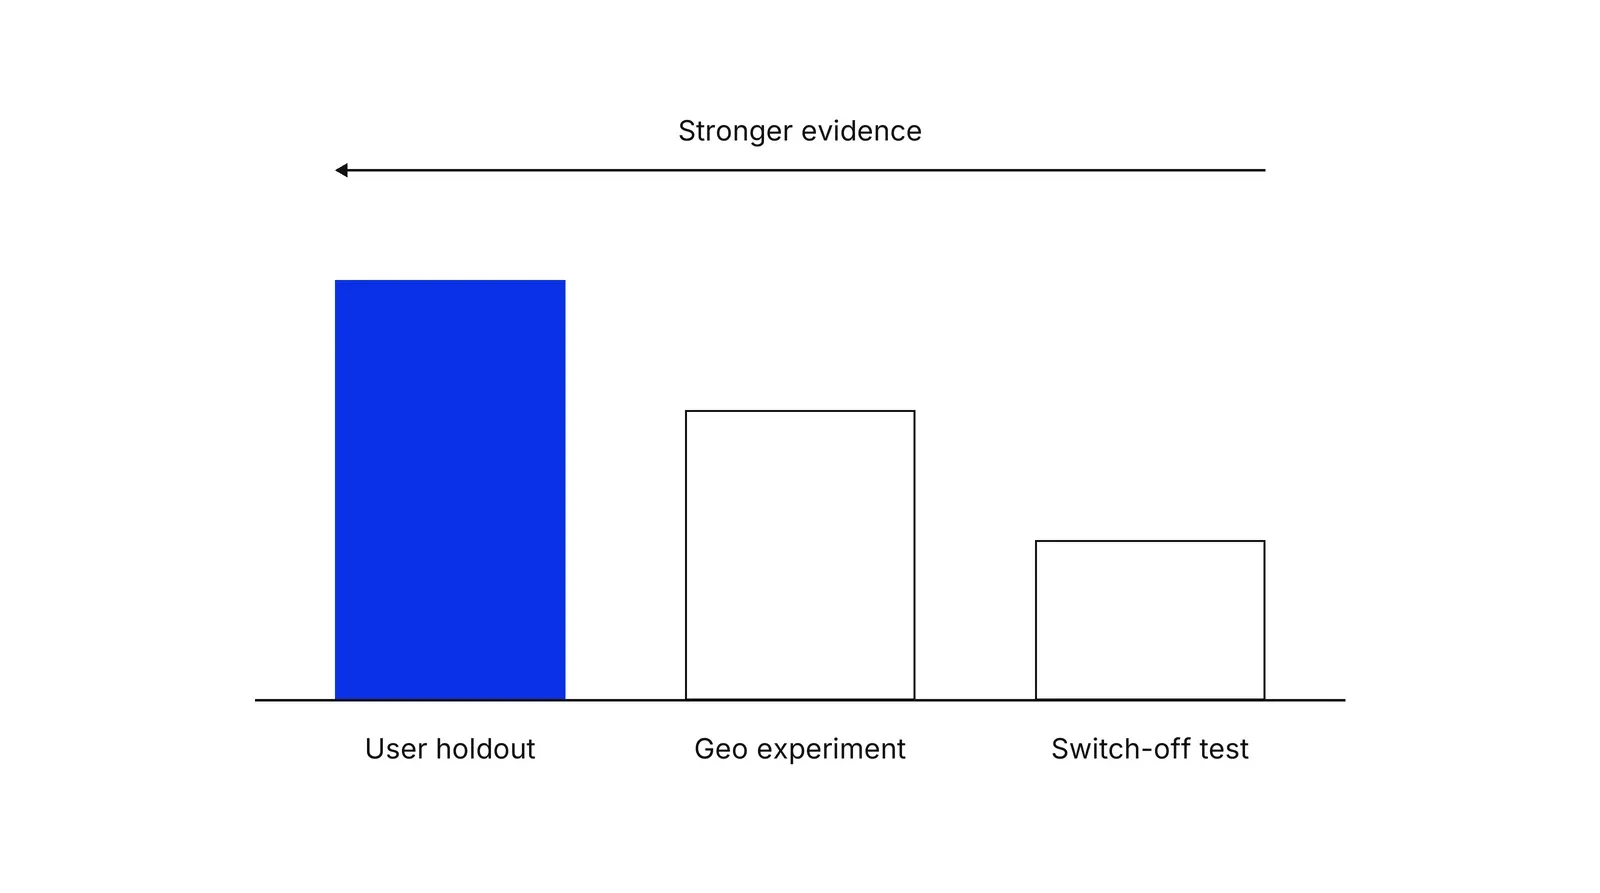
| Design | Unit randomized | Works for | Main weakness |
|---|---|---|---|
| User holdout | People or accounts | Platforms that offer a lift study, such as Google Conversion Lift or Meta lift studies | Access limited; platform grades its own work |
| Geo experiment | Cities or regions | Any channel you can target by location, including offline sales | Fewer units, so less statistical power; spillover between regions |
| Switch-off with a time-series model | Time periods | Channels you cannot split at all | No randomized control; a model guesses what would have happened |
User holdouts and ghost ads
A user holdout randomly assigns people to a test group that can see the ads and a control group that cannot. The hard part is knowing which control-group people would have been reached, because most people assigned to a campaign never see it.
Older tests solved this in two ways. Public service announcement (PSA) tests showed the control group a charity ad in the same slot. Intent-to-treat tests compared everyone assigned, reached or not. The ghost ads paper explains why both fall short. PSAs cost money, and on platforms that optimize delivery, the algorithm shows the PSA to different people than the real ad, so the groups stop being comparable. Intent-to-treat stays unbiased but becomes noisy when most assigned users are never reached.
Ghost ads log the moment when, for a control-group user, your ad would have won the auction, and serve the next ad instead. The comparison is then between people who saw your ad and their exact counterparts who would have. The authors report the same precision as PSA or intent-to-treat tests for at least an order of magnitude less spend. The retargeting page covers what this method found for that channel.
Geo experiments
A geo experiment randomly assigns whole regions to keep or lose the ads. Vaver and Koehler’s design has a pretest period in which all regions run the same campaigns, then a test period in which spend changes in the treatment regions. A linear model compares the two periods and returns the incremental return on ad spend. Grouping regions by size before random assignment, they note, can narrow the confidence interval by 10% or more.
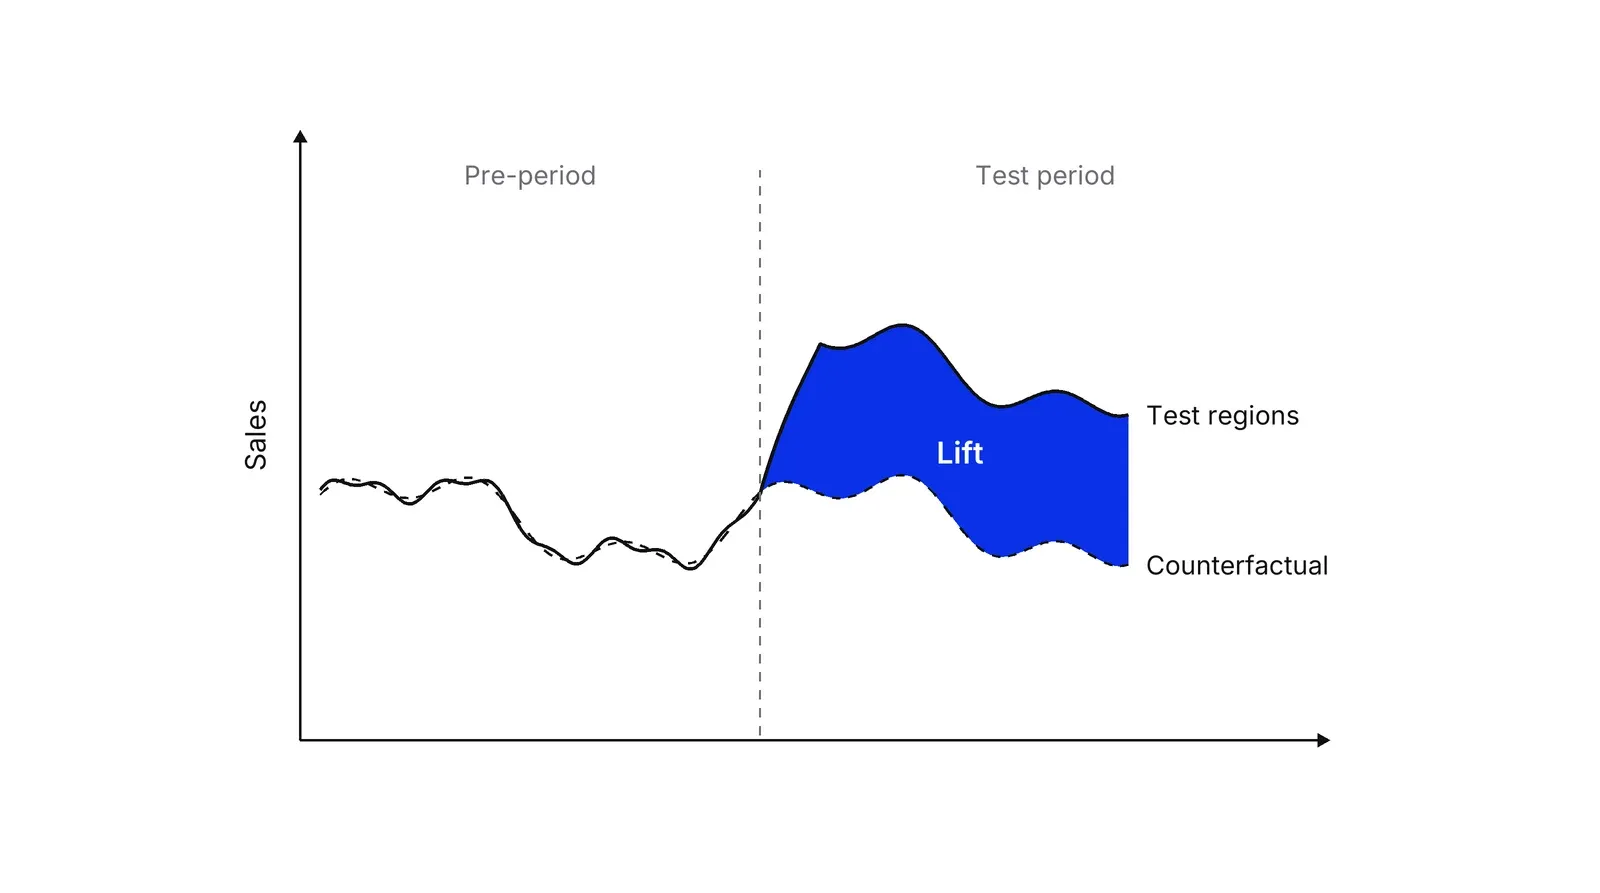
With only a few regions, that regression breaks down. Google’s time-based regression predicts the test regions’ sales from the control regions day by day instead. Meta’s open-source GeoLift builds a synthetic control, a weighted blend of untreated regions that tracks the test regions closely before launch, using the augmented method of Ben-Michael, Feller and Rothstein. Its documentation recommends people-based tests where possible because they have more power, and suggests geo tests for cases where those are not feasible, naming healthcare advertisers as one.
How big does a test need to be?
Bigger than most teams expect. Randall Lewis and Justin Rao studied 25 large experiments with $2.8 million in spend and found the median confidence interval on return was over 100 percentage points wide. Individual sales are so volatile that an informative test can need more than 10 million person-weeks.
Garrett Johnson’s guide to display-ad experiments puts it plainly: the effects are tiny, so the tests must be large. That is why GeoLift’s documentation insists on a power analysis before launch. A test that cannot detect the lift you expect will come back flat and get misread as proof the channel does nothing.
Why not model it from tracking data?
Because models built on observational data miss by more than the effect itself. Brett Gordon, Robert Moakler and Florian Zettelmeyer compared non-experimental estimates with 663 Facebook experiments. For lower-funnel outcomes such as purchases, the median experimental lift was 6%, and the median gap between the model and the experiment was 62 percentage points. An earlier Facebook study by Gordon and colleagues had already found that observational methods often failed to recover the experimental effects.
Experiments are expensive, so most teams use them to correct a model instead of replacing it. Meta’s Robyn treats lift results as ground truth during fitting, and Google’s Meridian documentation calls incrementality experiments perhaps the strongest basis for priors while warning that there is no single formula for the translation. How a marketing mix model uses those inputs is covered on its own page. A workable rhythm is one test slot per large channel in the quarterly calendar, with the result feeding the budget split, the way a Growth Lab experiment calendar is built.
How to apply Incrementality testing, step by step
- Write the question and the decision. Name one channel and one decision the result will drive, for example: if brand search ads bring fewer than 20% extra sign-ups, cut them by half. Pick the outcome the business cares about (paid orders, booked appointments, funded accounts), not clicks. Result: a one-line question and the threshold that changes the budget.
- Choose the design. Use a user-level holdout when the ad platform offers one, a geo experiment when it does not or when sales happen offline, and a switch-off with a time-series model only when neither is possible. Result: the design, the unit of randomization and the tool you will use.
- Size the test before launch. Run a power analysis on your history: how big a lift could this test detect, with how many people or regions, over how many weeks. If the detectable lift is larger than any lift you could plausibly get, make the test bigger or longer, or do not run it. Result: test length, holdout share and the minimum detectable lift, written down.
- Freeze everything except the treatment. Keep creatives, bids, prices and other channels the same in both groups for the whole period, and do not peek and stop early when the numbers look good. Result: a test log that lists every change made during the test, ideally none.
- Read lift, incremental CPA and iROAS. Compute incremental conversions (test minus scaled control), divide spend by them for incremental cost per acquisition, and divide incremental revenue by spend for iROAS. Report the confidence interval, not only the point estimate. Result: three numbers with intervals, compared against the threshold from step one.
- Act, then feed the model. Change the budget as agreed, and use the result to correct attribution weights or calibrate a marketing mix model. Schedule a retest for each large channel once or twice a year. Result: a budget change and a calendar of next tests.
Examples
eBay and brand search ads
Thomas Blake, Chris Nosko and Steven Tadelis stopped eBay's brand keyword ads on Yahoo and MSN while keeping them on Google as a comparison. According to the paper, 99.5% of the click traffic was retained, because users clicked the free organic link instead. For non-brand keywords they switched ads off in about 30% of US regions for 60 days. A simple regression gave a return of over 1,400% even with controls; the experiment gave minus 63%, because frequent eBay buyers, who would have purchased anyway, received most of the ad spend.
Ghost ads on a retailer's retargeting campaign
Johnson, Lewis and Nubbemeyer tested an online retailer's display retargeting with ghost ads: for people in the control group, the ad system logged when the retailer's ad would have won the auction, then showed whatever ad came next. The campaign raised site visits by 17.2% and purchases by 10.5%. The authors report that the method measures lift as precisely as public service announcement tests while spending at least an order of magnitude less.
A clinic network testing paid social by city
Illustrative, no real clinic implied. A clinic group in 12 cities spends on paid social everywhere and cannot hold out individual users because the platform restricts health targeting. It ranks cities by size, pairs them, and pauses paid social in one city of each pair for six weeks. Booked first visits in the paused cities fall by 120 below their predicted level, against 300 that the platform attributed to those cities in a comparable period. Spend saved in the paused cities was 18,000, so the incremental cost per booked visit is 150, against the 60 the dashboard showed.
When to use it
Use it when one channel takes a large share of the budget and its reported return looks too good, when a platform and your own analytics disagree on what it brought, before scaling brand search, retargeting or affiliate spend, and to calibrate a marketing mix model. It is most useful for channels where many buyers would have come anyway.
When not to use it
Skip it when spend is so small that no realistic lift could be detected, which a power analysis will show in an hour, or when you cannot keep the control group untouched for the full test. A one-week test during a sale or a holiday tells you little. Early-stage startups usually learn more from talking to customers about how they found the product.
Common mistakes
- Treating platform-reported conversions as the result, when they include buyers who would have converted without the ad.
- Launching without a power analysis, then reading a flat result as proof the channel does nothing when the test was simply too small to see the lift.
- Using public service announcement ads as the control on a platform that optimizes delivery, so the two groups end up seeing ads in different kinds of people.
- Letting other teams change prices, creatives or budgets in only one group during the test.
- Testing a channel once and treating the number as permanent, although lift changes with spend level, season and creative.
FAQ
What is incrementality in marketing, in simple words?
Incrementality is the part of your sales that happened because of an ad and would not have happened without it. If 1,000 people bought after seeing an ad but 800 similar people bought without seeing it, only 200 sales are incremental. Incrementality testing is how you measure that 200 instead of guessing it.
How is incrementality testing different from an A/B test?
An A/B test compares two versions of an ad or page, and both groups see something. An incrementality test compares seeing the ad with not seeing it, so one group gets no ad from that campaign. Both are randomized experiments; the incrementality test answers whether the spend works at all, the A/B test answers which version works better.
How is incrementality different from attribution?
Attribution splits credit for conversions that happened across the ads a person touched, using tracking data. It cannot tell whether the person would have converted anyway. Incrementality testing uses a control group to measure exactly that. Many teams use attribution for daily optimization and run incrementality tests to correct it.
How long should an incrementality test run?
Long enough for the power analysis to say the expected lift is detectable, and long enough to cover your sales cycle. In practice that usually means planning for four to eight weeks. Vaver and Koehler's geo design adds a pretest period from history so the regions can be compared before the change.
What is a good incrementality test for a small budget?
A geo experiment on paired regions or a platform conversion lift test if you qualify for one. Lewis and Rao showed that individual sales are so noisy that informative user-level tests can need more than 10 million person-weeks, so small advertisers often get a clearer answer by switching a channel off in some regions and comparing.
Sources
- Jon Vaver, Jim Koehler, Measuring Ad Effectiveness Using Geo Experiments, Google, 2011
- Jon Vaver, Jim Koehler, Measuring Ad Effectiveness Using Geo Experiments, full text, Google Research
- Jouni Kerman, Peng Wang, Jon Vaver, Estimating Ad Effectiveness Using Geo Experiments in a Time-Based Regression Framework, Google, 2017
- Thomas Blake, Chris Nosko, Steven Tadelis, Consumer Heterogeneity and Paid Search Effectiveness: A Large-Scale Field Experiment, Econometrica 83(1), 2015
- Thomas Blake, Chris Nosko, Steven Tadelis, Consumer Heterogeneity and Paid Search Effectiveness, author version, UC Berkeley Haas
- National Bureau of Economic Research, Working Paper 20171, Consumer Heterogeneity and Paid Search Effectiveness, 2014
- Garrett A. Johnson, Randall A. Lewis, Elmar I. Nubbemeyer, Ghost Ads: Improving the Economics of Measuring Online Ad Effectiveness, Journal of Marketing Research 54(6), 2017
- Garrett A. Johnson, Randall A. Lewis, Elmar I. Nubbemeyer, Ghost Ads, NBER conference version, 2016
- Garrett A. Johnson, Inferno: A guide to field experiments in online display advertising, Journal of Economics and Management Strategy 32(3), 2023
- Randall A. Lewis, Justin M. Rao, The Unfavorable Economics of Measuring the Returns to Advertising, Quarterly Journal of Economics 130(4), 2015
- Brett R. Gordon, Florian Zettelmeyer, Neha Bhargava, Dan Chapsky, A Comparison of Approaches to Advertising Measurement: Evidence from Big Field Experiments at Facebook, Marketing Science 38(2), 2019
- Brett R. Gordon, Robert Moakler, Florian Zettelmeyer, Close Enough? A Large-Scale Exploration of Non-Experimental Approaches to Advertising Measurement, Marketing Science 42(4), 2023
- Kellogg School of Management, Close Enough? research abstract, 2023
- Leonard M. Lodish et al., How T.V. Advertising Works: A Meta-Analysis of 389 Real World Split Cable T.V. Advertising Experiments, Journal of Marketing Research 32(2), 1995
- Meta Open Source, GeoLift
- Meta Open Source, GeoLift documentation, Introduction
- Meta Open Source, GeoLift documentation, Methodology
- Alberto Abadie, Alexis Diamond, Jens Hainmueller, Synthetic Control Methods for Comparative Case Studies, Journal of the American Statistical Association 105(490), 2010
- Eli Ben-Michael, Avi Feller, Jesse Rothstein, The Augmented Synthetic Control Method, Journal of the American Statistical Association 116(536), 2021
- Kay H. Brodersen et al., Inferring causal impact using Bayesian structural time-series models, Annals of Applied Statistics 9(1), 2015
- Google, trimmed_match: analysis and design of randomized paired geo experiments
- Google Ads Help, About Conversion Lift
- Meta for Developers, Lift studies
- Meta Marketing Science, Robyn features: calibration with experiments
- Google Meridian, ROI priors and calibration
- Ron Kohavi, Diane Tang, Ya Xu, Trustworthy Online Controlled Experiments, Cambridge University Press, 2020
Last updated Oct 9, 2026


Marketing agency or growth system: when a company outgrows its agency
An agency is the right call while the founder still runs most of the company. Once the business starts copying itself into new locations or markets, it needs a system that sets goals, tests hypotheses and owns the result.

Why healthcare marketing agencies stall: the short, mid and long wins model we use with clinics
Most agencies own the click and nobody owns the front desk. How we structure clinic work in three horizons, the research behind each one, and one year of results.

Why channel tests stall after month three
Most paid channel tests do not end with a decision. They end when the budget runs out, the attribution model changes, or everyone quietly stops looking at the dashboard.