Data-driven attribution and MTA
Data-driven attribution fits a model to converting and non-converting customer paths, then splits credit by each touchpoint's estimated contribution; it is a better descriptive tool than fixed rules, and still not proof of cause.
Multi-touch attribution (MTA) assigns credit for a conversion to several marketing touchpoints. Data-driven attribution does it with a model fitted to converting and non-converting paths, using methods such as Shapley values or Markov chains instead of fixed weights. It describes a path more fairly than last click, but experiments show it can still miss what ads actually caused.
- Origin
- Xuhui Shao and Lexin Li (data-driven MTA, 2011); Brian Dalessandro and colleagues (2012); Eva Anderl and colleagues (Markov graphs, 2016); productised by Google, 2011 to 2016 in research; no single date for the products
- Level
- 301 · Advanced
- Fits
- Scale-up, Enterprise
- Time to apply
- two to four weeks to compare a model against one test
- What you need
- path data: ordered touchpoints for both converting and non-converting users · a conversion volume that supports modelling (Google suggests 200 conversions a month as a floor for its own model) · one channel where you can run a holdout or geo test
Multi-touch attribution (MTA) is the practice of splitting credit for one conversion across several touchpoints in a customer’s path. Data-driven attribution is the version where a fitted model, not a fixed rule, decides the split. The rule-based versions, such as last click, linear and position-based, are covered on the attribution models page. This page starts where that one stops: what a model does differently, and how far you can trust it.
What makes attribution data-driven
Data-driven attribution learns from both the paths that ended in a sale and the paths that did not. A fixed rule gives the last click 100% whatever the data says. A model asks which touchpoints raise the chance of conversion and credits them in that proportion. Google’s help describes this as comparing converting and non-converting paths, with a model specific to each advertiser.
The idea was formalised in academic work before it became a product. Shao and Li presented data-driven multi-touch attribution at KDD in 2011, with two models: a bagged logistic regression and a simple probabilistic model. Dalessandro and colleagues framed attribution a year later as a causal estimation problem and proposed approximations drawn from cooperative game theory. Kannan, Reinartz and Verhoef later summarised the field around one aim: the incremental value of each touchpoint and the spillover between channels.
Shapley-value attribution
Shapley-value attribution credits each touchpoint with its average marginal contribution across all the combinations of touchpoints it could join. The method comes from Lloyd Shapley’s 1953 paper on dividing a team’s output fairly among its members. In advertising the team members are channels and the output is conversions.
A simple case: Display adds one point to the conversion chance when it joins a path with Search, and three points when it joins a path with Email. Its Shapley credit is its marginal gain averaged across every such combination and order.
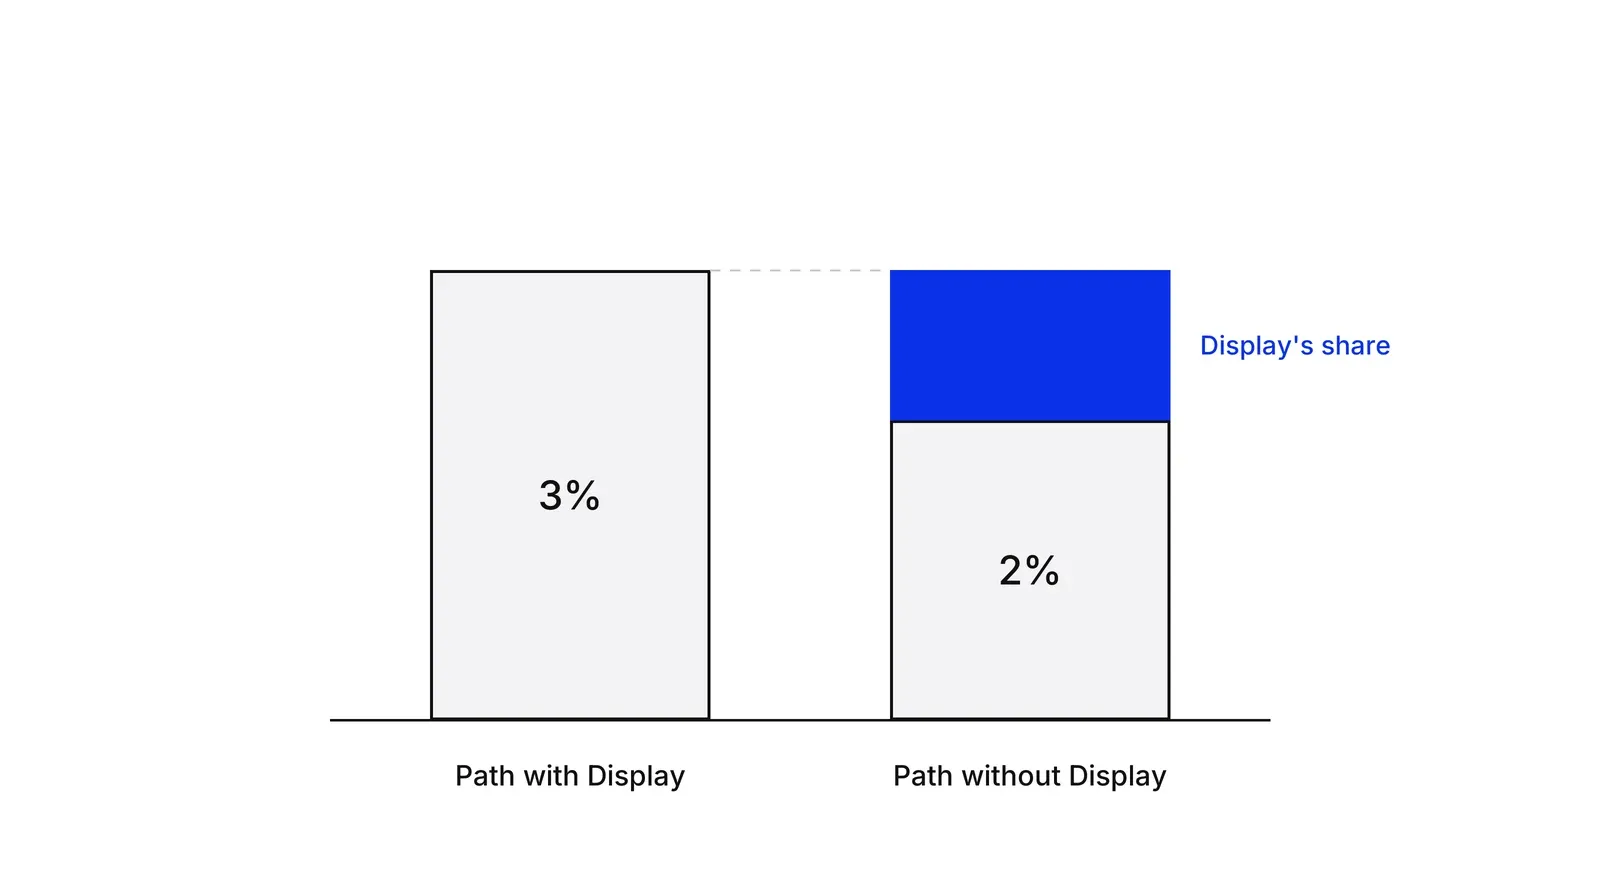
Google’s description of its Analytics 360 model has two steps: model the conversion probability from converting and non-converting users, then apply an algorithm based on the Shapley value to split credit. Its example gives a path with Organic Search, Display and Email a 3% conversion probability, and 2% without Display. Order matters: Display before Paid Search is modelled separately from the reverse.
Berman showed in a game-theory model that a Shapley-value method raises advertiser profit relative to last touch, because last-touch pay overincentivizes exposures. Singal and colleagues argued that the classic Shapley value needs adjusting for advertising and proposed a counterfactual adjusted version.
Markov-chain attribution
Markov-chain attribution models the customer journey as steps between states, such as channels, ending in a conversion or in a drop-out. Anderl and colleagues modelled paths as first- and higher-order Markov walks and applied them to four large datasets, each with at least seven online channels. They found substantial differences from last click, plus carryover and spillover effects between channels.
The common way to score a channel in these models is the removal effect: delete the channel from the graph and see how much total conversion probability falls. Channels are then credited in proportion to their removal effects. The open-source ChannelAttribution package implements a k-order Markov model alongside first-, last- and linear-touch rules.
| Method | Question it answers | Needs | Weak point |
|---|---|---|---|
| Shapley | What does each touch add across all combinations? | A conversion-probability model for every path | Combinations grow fast with channels |
| Markov chain | What is lost if a channel vanishes from the graph? | Ordered paths, converters and non-converters | Depends on the chosen order of the chain |
| Logistic or neural models | Which touches predict a conversion? | Lots of labelled paths | Prediction is not cause |
Newer work follows the same logic with more machinery. DNAMTA adds attention layers and user controls to predict conversions from exposure sequences, and LinkedIn’s LiDDA uses a transformer and pulls its channel totals toward a marketing mix model.
How Google’s data-driven attribution works in practice
Google’s model is the one most advertisers meet first. Google Ads help lists last click and data-driven as the two current models and calls data-driven the default for most conversion actions. GA4’s help says its model uses machine learning on converting and non-converting paths, considers time from the key event, device, number of ad interactions, exposure order and creative asset type, and compares exposed users with a holdback group. Conversions can be reattributed for up to seven days after the event.
Two limits are worth knowing. The model sees only the touches its own platform logs, and it needs volume: Google recommends at least 200 conversions and 2,000 ad interactions in 30 days for a good fit. Apple’s App Tracking Transparency framework adds another gap on mobile, because apps need user permission before tracking across other companies’ apps and sites.
Do these models agree with experiments?
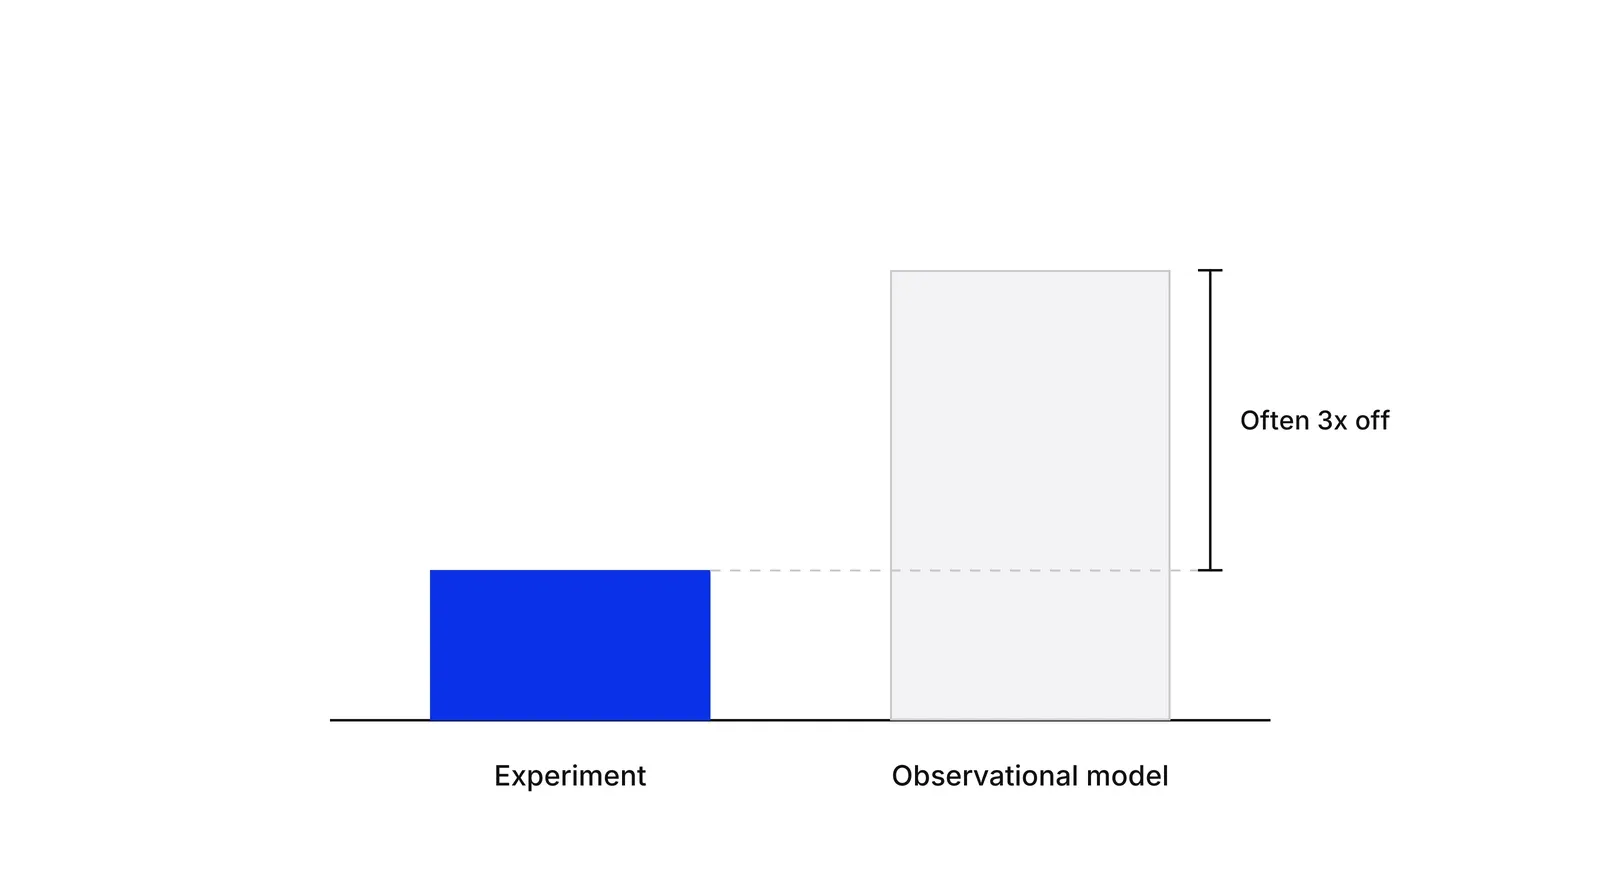
Often they do not. Gordon, Zettelmeyer, Bhargava and Chapsky used 15 Facebook experiments, 500 million user-experiment observations and 1.6 billion ad impressions to test observational methods against randomized results. Their working paper reports that the methods mostly overestimated lift, sometimes underestimated it, and in half of the studies were off by a factor of three.
Their 2023 follow-up used 663 Facebook experiments and more than 5,000 user-level features. They conclude that, even with that data, they could not reliably estimate an ad campaign’s causal effect. Earlier, Blake, Nosko and Tadelis found at eBay that brand-keyword ads showed no measurable short-term benefit, and Lewis and Rao reported selection bias from ad targeting as a serious problem for observational methods.
A path model sits on the observational side of this line. It is better than a fixed rule at describing the path. It is not a substitute for a test.
Using it next to experiments
Treat the model as the weekly view and the experiment as the check. Incrementality testing measures lift directly. Ghost ads lower its cost on platforms that allow it, and geo experiments randomize by region, as the geo-lift testing page explains. Marketing mix modeling covers channels with no logged touch, and unified measurement shows how the three layers combine. The logic of why this works sits on the causal inference page. A Growth Lab plan starts from a measurement stack like this one before budgets move.
How to apply Data-driven attribution and MTA, step by step
- Define the conversion and the touchpoints. Pick one conversion, such as a paid booking, and list which touchpoints the data records: ad clicks, ad views, emails, site visits. Say what is not recorded, such as podcasts or word of mouth. Result: a one-page spec of what the model can and cannot see.
- Build paths for converters and non-converters. Export ordered touchpoint sequences per user, including users who never converted. A model that sees only converters cannot learn what a touchpoint adds. Result: a path table with a converted flag.
- Fit one model and read credit by channel. Use the built-in data-driven model in Google Ads or GA4, or fit a Markov or Shapley model yourself. Compare its credit with last click. Result: a table of channels with credit under both.
- Mark the channels where the model disagrees most with last click. Large gaps point to channels that open or assist paths, or to channels that merely sit near the sale. The model cannot say which. Result: a short list of channels to test.
- Test the top gap with an experiment. Run a holdout, a ghost-ads design or a geo test on the channel with the largest gap and compare the measured lift with the model's credit. Result: one calibration ratio, credit versus lift.
- Use the model for trends and the test for budget moves. Keep the model in weekly reporting, scaled by the calibration ratio, and move large budgets only on test results. Result: a reporting rule that names which number answers which question.
Examples
Display, Search and Email in a worked split
Illustrative arithmetic, no real company implied. A Markov model is fitted to a clinic's booking paths and says that removing paid social would cost 40 bookings, removing search 30 and removing email 10. The removal effects sum to 80, so the 100 bookings are split 50, 37.5 and 12.5. Last click would have given most of the 100 to search.
Google's own example of a counterfactual gain
In Google Analytics help, a path of Organic Search, Display and Email has a 3% chance of converting, and the same path without Display has 2%. The 50% relative lift when Display is present is the basis for crediting Display. It is a model comparison across similar users, not a randomized test.
Facebook's 15 experiments
Gordon, Zettelmeyer, Bhargava and Chapsky compared observational estimates with randomized tests in 15 Facebook campaigns. Per their working paper, in half of the studies the estimated percentage increase in purchases was off by a factor of three. Models fitted to path data share the same risk.
When to use it
Use data-driven attribution when you run several channels with enough conversions, when last click clearly under-credits upper-funnel work, and when you want a stable weekly view of channel contribution. Use it alongside tests, not instead of them.
When not to use it
Do not use it as proof that a channel works, to move a large budget without a holdout, or with a few dozen conversions a month. Channels that leave no logged touch, such as podcasts, offline media or word of mouth, are invisible to any path model.
Common mistakes
- Reading data-driven credit as incremental lift, when the model only redistributes sales that happened.
- Fitting a model on converting paths only, so the model cannot learn which touches did nothing.
- Comparing Google's data-driven credit with another platform's without checking that windows, conversions and touch types match.
- Trusting the model more because it is complex. Gordon and colleagues found rich data and deep learning still failed to recover experimental effects.
- Dropping tests once a model is live. The model has nothing to calibrate against without them.
FAQ
What is multi-touch attribution?
Multi-touch attribution spreads credit for one conversion across several touchpoints in a customer path. The split can use fixed rules, such as linear or position-based, or a fitted model, such as Shapley values or Markov chains. Data-driven attribution is the model-based kind.
Is data-driven attribution better than last click?
It is usually closer to the real path, because it looks at paths that did not convert and gives credit to assists. Better as a description does not mean better as a cause estimate. Gordon and colleagues found observational methods often miss experimental effects, so test the large decisions.
What is the difference between Shapley and Markov attribution?
Shapley attribution divides credit by averaging a touchpoint's marginal contribution over combinations of touchpoints, a method from cooperative game theory. Markov attribution models the path as steps between channels and scores a channel by how much conversion falls when it is removed. Both depend on the path data fed in.
How much data does Google data-driven attribution need?
Google Ads help recommends at least 200 conversions and 2,000 ad interactions in a 30-day period in supported networks. All conversion actions are eligible regardless of volume, but credit is less precise on low volumes, and each model is specific to one advertiser.
Sources
- Google Ads Help, About data-driven attribution
- Google Ads Help, About attribution models
- Google Analytics Help, Advertising and attribution (GA4)
- Google Analytics Help, Data-Driven Attribution methodology (Universal Analytics 360)
- Xuhui Shao, Lexin Li, Data-driven multi-touch attribution models, ACM SIGKDD 2011
- Brian Dalessandro, Claudia Perlich, Ori Stitelman, Foster Provost, Causally motivated attribution for online advertising, ADKDD 2012
- Eva Anderl, Ingo Becker, Florian von Wangenheim, Jan H. Schumann, Mapping the customer journey: Lessons learned from graph-based online attribution modeling, International Journal of Research in Marketing 33(3), 2016
- Hongshuang (Alice) Li, P. K. Kannan, Attributing Conversions in a Multichannel Online Marketing Environment, Journal of Marketing Research 51(1), 2014
- P. K. Kannan, Werner Reinartz, Peter C. Verhoef, The path to purchase and attribution modeling: Introduction to special section, International Journal of Research in Marketing 33(3), 2016
- Lloyd S. Shapley, A Value for n-Person Games, in Contributions to the Theory of Games II, Princeton University Press, 1953
- Ron Berman, Beyond the Last Touch: Attribution in Online Advertising, Marketing Science 37(5), 2018
- Raghav Singal, Omar Besbes, Antoine Desir, Vineet Goyal, Garud Iyengar, Shapley Meets Uniform: An Axiomatic Framework for Attribution in Online Advertising, Management Science 68(10), 2022
- Brett R. Gordon, Florian Zettelmeyer, Neha Bhargava, Dan Chapsky, A Comparison of Approaches to Advertising Measurement: Evidence from Big Field Experiments at Facebook, Marketing Science 38(2), 2019
- Brett R. Gordon, Florian Zettelmeyer, Neha Bhargava, Dan Chapsky, A Comparison of Approaches to Advertising Measurement, working paper, Kellogg School of Management, 2018
- Brett R. Gordon, Robert Moakler, Florian Zettelmeyer, Close Enough? A Large-Scale Exploration of Non-Experimental Approaches to Advertising Measurement, Marketing Science 42(4), 2023
- Close Enough? arXiv version 2, 2022
- Thomas Blake, Chris Nosko, Steven Tadelis, Consumer Heterogeneity and Paid Search Effectiveness: A Large-Scale Field Experiment, NBER Working Paper 20171, 2014
- Randall A. Lewis, Justin M. Rao, The Unfavorable Economics of Measuring the Returns to Advertising, Quarterly Journal of Economics 130(4), 2015
- Garrett A. Johnson, Randall A. Lewis, Elmar I. Nubbemeyer, Ghost Ads: Improving the Economics of Measuring Online Ad Effectiveness, Journal of Marketing Research 54(6), 2017
- Jon Vaver, Jim Koehler, Measuring Ad Effectiveness Using Geo Experiments, Google Research, 2011
- Ning Li, Sai Kumar Arava, Chen Dong, Zhenyu Yan, Abhishek Pani, Deep Neural Net with Attention for Multi-channel Multi-touch Attribution, arXiv 1809.02230
- LiDDA: Data Driven Attribution at LinkedIn, arXiv 2505.09861
- ChannelAttribution package description, CRAN
- Apple Developer Documentation, App Tracking Transparency
Last updated Oct 9, 2026


Marketing agency or growth system: when a company outgrows its agency
An agency is the right call while the founder still runs most of the company. Once the business starts copying itself into new locations or markets, it needs a system that sets goals, tests hypotheses and owns the result.

Why healthcare marketing agencies stall: the short, mid and long wins model we use with clinics
Most agencies own the click and nobody owns the front desk. How we structure clinic work in three horizons, the research behind each one, and one year of results.

Why channel tests stall after month three
Most paid channel tests do not end with a decision. They end when the budget runs out, the attribution model changes, or everyone quietly stops looking at the dashboard.